

Описание
ИДЕЯ
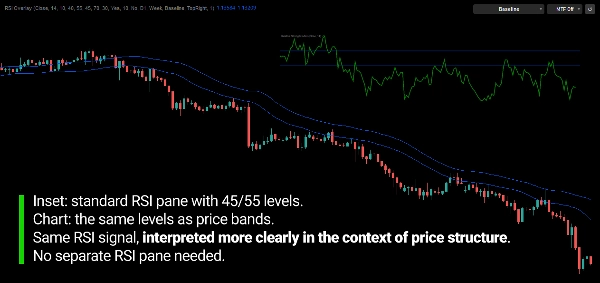
RSI, который переводит свои уровни в цену и отображает их непосредственно на графике, удерживая импульс и цену в одном пространстве вместо отдельной панели.
ПРОБЛЕМА
RSI обычно читается в отдельной панели.
Чтобы использовать его, вы должны постоянно сравнивать значение осциллятора с тем, что происходит с ценой на основном графике.
Уровни, такие как 70, 30 или 50, — это числа на осцилляторе. Они не показывают, где должна находиться цена, чтобы RSI достиг этих уровней.
Поэтому вы постоянно переводите взглядом: «RSI на уровне 62 — где это на графике?»
Проблема не в самом RSI.
Проблема в том, что импульс и цена показаны в двух разных местах, в двух разных единицах измерения.
ОСНОВНАЯ ИДЕЯ: УРОВНИ RSI СТАНОВЯТСЯ УРОВНЯМИ ЦЕНЫ.
Традиционный RSI задаёт вопрос:
«Каково текущее значение RSI?»
RSI Overlay задаёт вопрос:
«По какой цене RSI достигнет этого уровня?»
Каждый уровень RSI преобразуется в соответствующий уровень цены и отображается непосредственно на графике.
Осциллятор больше не нужно читать в одном окне и переводить в другое.
Его информация выражена в той же ценовой шкале, что и движение, которое вы уже анализируете.
RSI задаёт уровень. График показывает его в цене.
ЧТО ОН ДЕЛАЕТ
RSI Overlay преобразует выбранные уровни RSI в динамические уровни цены и отображает их непосредственно на основном графике.
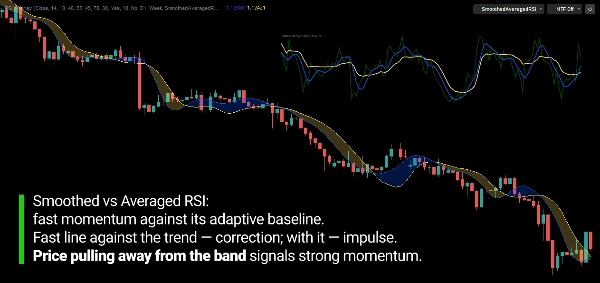
Бычьи и медвежьи базовые линии, уровни перекупленности и перепроданности, а также две ссылки на RSI — сглаженный RSI и усреднённый RSI — все представлены в виде ценовых линий.
Линии обновляются с каждым новым баром, поэтому они продолжают отражать текущее состояние RSI, а не остаются фиксированными на исторической цене.
Это не обычные уровни поддержки или сопротивления.
Они показывают цену, при которой соответствующее значение RSI будет достигнуто при текущем расчёте RSI.
Индикатор не пытается предсказать, куда пойдёт цена.
Он показывает, где находится цена относительно наблюдаемых вами уровней RSI.
КАК ЭТО РАБОТАЕТ
- RSI рассчитывается с использованием сглаживания Уайлдера.
- Каждый уровень RSI преобразуется в цену, которая его породит.
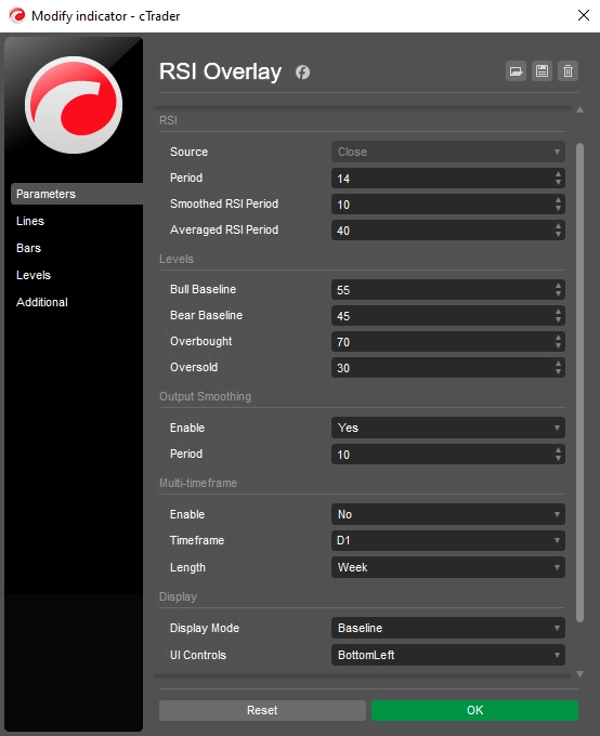
- Бычьи и медвежьи базовые линии обозначают зону импульса вокруг центральной линии (по умолчанию 55 / 45).
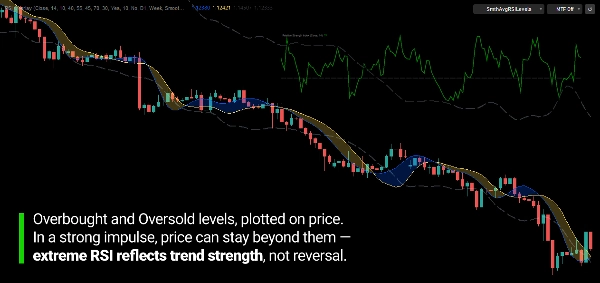
- Уровни перекупленности и перепроданности преобразуются аналогичным образом (по умолчанию 70 / 30).
- Сглаженный RSI и усреднённый RSI также преобразуются в ценовые линии.
ССЫЛКИ RSI
Бычьи / Медвежьи базовые линии
Ценовые уровни, при достижении которых RSI входит в зону бычьего или медвежьего импульса. Пространство между ними показывает, где импульс нейтрален.
Сглаженный RSI
Версия RSI с уменьшенным шумом, отображаемая в виде ценовой линии, которая реагирует более плавно.
Усреднённый RSI
Более медленное адаптивное среднее RSI, отображаемое в виде ценовой линии. Обеспечивает более стабильную ссылку на импульс.
Перекупленность / Перепроданность
Ценовые уровни, при достижении которых RSI достигает порогов перекупленности и перепроданности.
Эти ссылки не являются автоматическими сигналами.
Их положение относительно цены и друг друга даёт контекст о том, как развивается импульс.
МНОГОТАЙМФРЕЙМНЫЙ КОНТЕКСТ
RSI не обязательно должен быть из таймфрейма графика, который вы просматриваете.
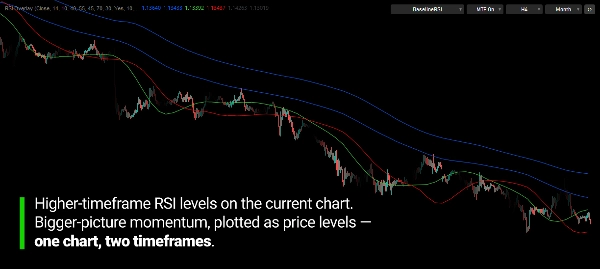
Например, недельный или месячный RSI может быть проецирован на график H1.
Это помещает рамки импульса более высокого таймфрейма непосредственно на ценовое движение, которое вы наблюдаете.
Вы выбираете, сколько истории отображать — от последнего часа до нескольких лет.
Выбранный таймфрейм должен быть выше таймфрейма графика.
УПРАВЛЕНИЕ С ГРАФИКА
Одиннадцать режимов отображения позволяют показывать только то, что вам нужно — от чистой пары базовых линий до полного набора ссылок RSI.
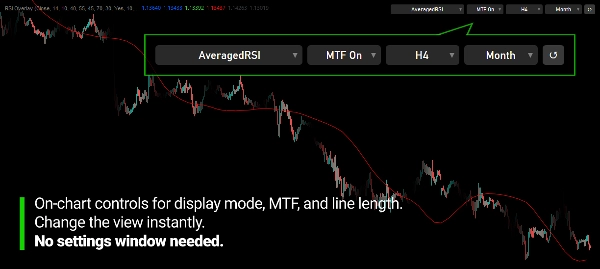
Компактная панель управления на графике позволяет переключать режим отображения, включать или выключать много таймфреймов, а также менять таймфрейм и длину без повторного открытия настроек.
Кнопка сброса возвращает всё к исходным параметрам.
Панель можно разместить в любом углу или скрыть.
ЧТО ВЫ МОЖЕТЕ НАБЛЮДАТЬ
Индикатор разработан для того, чтобы сделать видимыми несколько вещей:
- Где находится цена относительно зон бычьего и медвежьего импульса
- Насколько далеко цена от уровней перекупленности и перепроданности в ценовом выражении
- Сдвиги импульса вокруг базовых линий
- Откаты и продолжение относительно сглаженного и усреднённого RSI
- Контекст импульса более высокого таймфрейма на графике более низкого таймфрейма
RSI Overlay — это инструмент измерения, а не автономная система покупки/продажи.
РАЗРАБОТАН ДЛЯ ИЗМЕРЕНИЯ ИМПУЛЬСА В ЦЕНОВОМ ВЫРАЖЕНИИ
Цель не заменить RSI.
Цель — убрать необходимость переводить осциллятор обратно в цену взглядом.
Всё, что вы знаете о RSI, по-прежнему применимо. Просто теперь это показано там, где принимаются решения: на ценовом графике.
КЛЮЧЕВЫЕ ОСОБЕННОСТИ
- Уровни RSI, преобразованные в уровни цены на основном графике
- Бычьи и медвежьи базовые линии (по умолчанию 55 / 45)
- Ценовые уровни перекупленности и перепроданности (по умолчанию 70 / 30)
- Линия сглаженного RSI
- Линия усреднённого RSI
- Много таймфреймов RSI на графиках с более низким таймфреймом
- Выбираемая длина отображения для много таймфреймовых линий
- 11 режимов отображения
- Панель управления на графике с кнопкой сброса
- Настраиваемый источник, период RSI, сглаживание и усреднение
- Настраиваемые цвета, стили линий и толщина
---
Торговля связана с риском. Этот индикатор является инструментом технического анализа и должен использоваться вместе с соответствующим управлением рисками.
Сводка
It supports multi-timeframe analysis by allowing RSI data from higher timeframes (e.g., weekly or monthly) to be displayed on lower timeframe charts, providing broader momentum context. Users can customize display modes, line styles, colors, and control parameters directly from an on-chart control bar, which includes options to reset settings and adjust timeframe and length without reopening menus.
RSI Overlay serves as a measurement tool to visualize where price stands relative to momentum zones and RSI thresholds in price terms. It does not generate automatic trading signals but aids in observing momentum shifts, pullbacks, and continuations aligned with RSI levels on the price chart.
Отзывы покупателей
5 | 100 % | |
4 | 0 % | |
3 | 0 % | |
2 | 0 % | |
1 | 0 % |
Обсуждение
Частые вопросы
Больше от этого автора























Цена
