
Описание
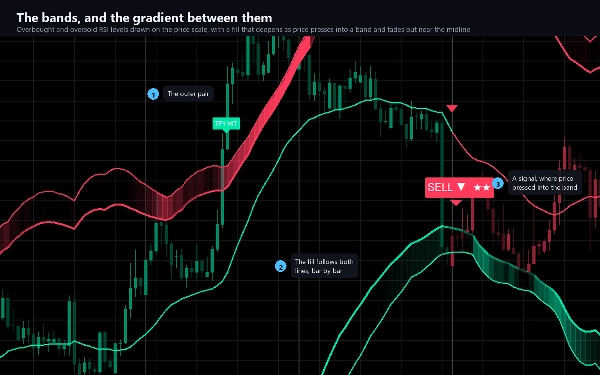
Reverse RSI Phantom переворачивает RSI с ног на голову. Вместо того чтобы рисовать осциллятор в отдельном окне под
графиком, он решает формулу RSI в обратном направлении и задаёт другой вопрос: какая цена установит
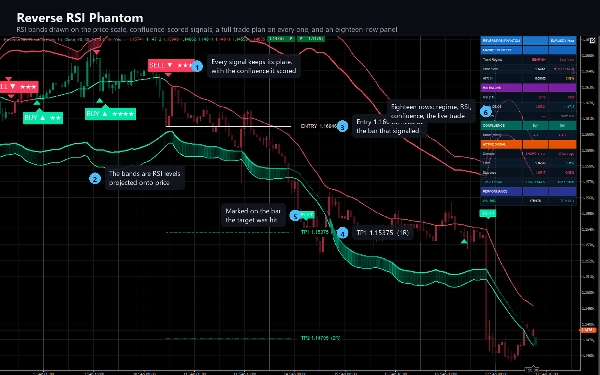
RSI ровно на уровне 70, а какая цена — на уровне 30? Эти две цены отображаются на графике в виде
полос, которые движутся с каждым баром.
Это одно изменение переносит весь осциллятор на ценовую шкалу, где вы можете видеть его на фоне
свечей, ваших уровней и плана, который индикатор рисует для вас.
ЧТО ОН РИСУЕТ
- Две полосы и их внешние границы на уровнях перекупленности и перепроданности, которые вы выбираете, проецируемые на
цену и при желании сглаженные.
- Градиентная заливка внутри каждой полосы, которая усиливается, когда цена давит на неё, и полностью исчезает
рядом с центральной линией, так что график показывает, где давление, без единого числа.
- Центральная линия, несущая цвет режима тренда.
- Свечи, окрашенные в тот же цвет режима, чтобы направление было читаемо с первого взгляда.
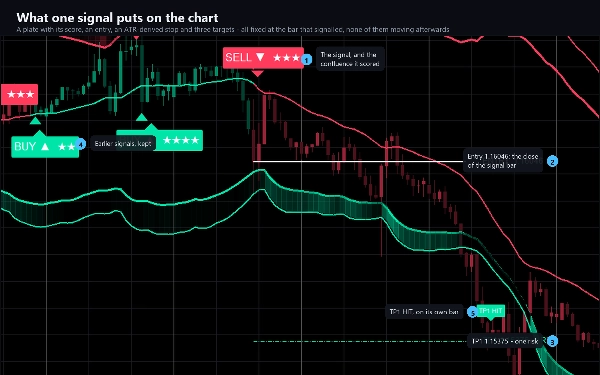
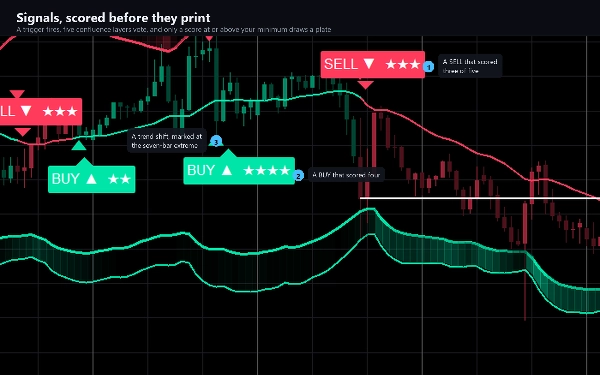
- Табличка на каждом сигнальном баре — BUY или SELL — с оценкой конвергенции из пяти.
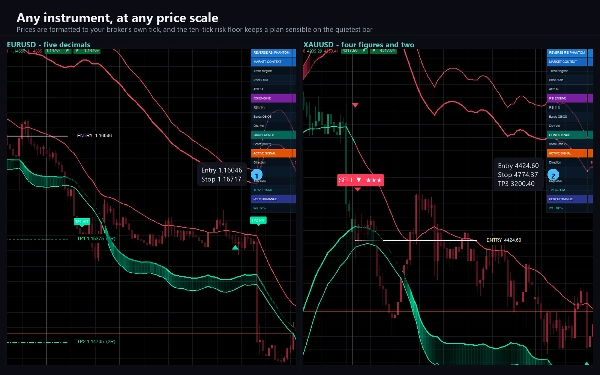
- Полный торговый план на сигнальном баре: вход, стоп на основе ATR и три цели с установленными вами
кратностями риска. Пять линий и пять ценников, все зафиксированы на баре, который дал сигнал.
- Табличка на баре, который достигает каждой цели, и на баре, который касается стопа.
- Треугольники там, где меняется режим тренда, и отметки там, где RSI расходится с ценой.
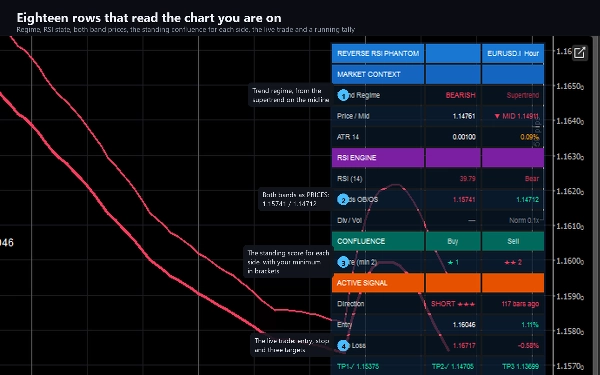
- Панель из восемнадцати строк: режим, цена относительно центральной линии, ATR, RSI и его состояние, обе полосы как
цены, дивергенция, объём, текущая конвергенция для каждой стороны, активная сделка с входом,
стопом и тремя целями, а также текущий итог того, что показала история графика.
КАК ОН ПРИНИМАЕТ РЕШЕНИЯ
Сигнал — это не одно условие. Срабатывает триггер — меняется режим, цена пересекает полосу или
подтверждается дивергенция — и затем пять слоёв конвергенции голосуют: режим, подтверждение RSI, повторное тестирование полосы, дивергенция и проверка объёма. Оценка от 0 до 5, отображается в виде звёзд на табличке,
и должна достигать минимума, который вы установили, прежде чем что-либо будет нарисовано. Фильтр трендовых ворот и фильтр охлаждения по направлению отфильтровывают оставшееся, и если обе стороны подходят на одном баре, побеждает более высокий балл.
Режим без перерисовки включён по умолчанию: бар оценивается только после закрытия, поэтому табличка, которая появляется,
никогда не двигается и не исчезает.
КЛЮЧЕВЫЕ НАСТРОЙКИ
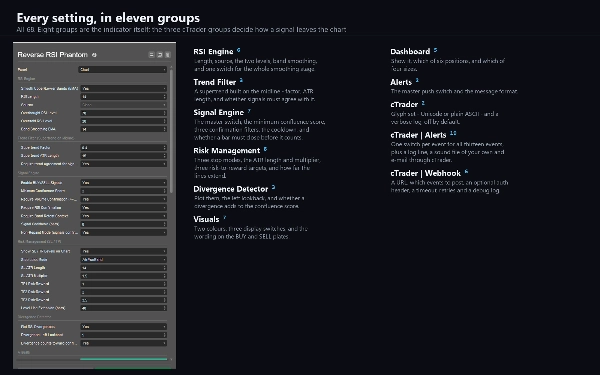
68 в одиннадцати группах. Длина RSI, источник и два уровня; сглаживание полос; фактор фильтра супер-тренда и длина ATR; минимальный балл конвергенции и три фильтра подтверждения; время охлаждения сигнала; три режима стопа с длиной ATR и множителем; три цели с соотношением риск-доход; период дивергенции; два цвета и надписи на табличках; положение и размер панели; и три группы только для cTrader для оповещений и вебхука.
ОПОВЕЩЕНИЯ И ВЕБХУК
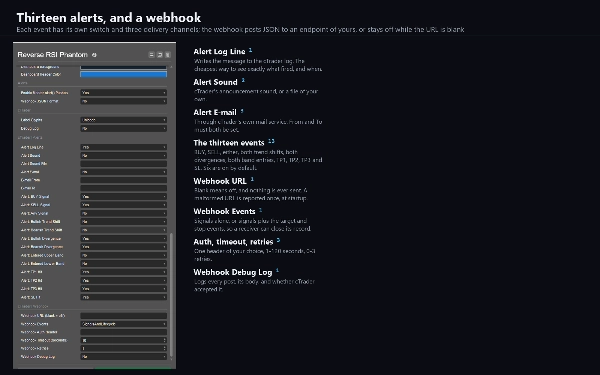
Тринадцать событий, каждое с собственным переключателем: BUY, SELL, любой, оба сдвига тренда, обе дивергенции, оба входа в полосы, все три цели и стоп. Доставляется в виде строки лога cTrader, звука по вашему выбору и электронной почты. Ничего не срабатывает, пока индикатор проходит историю графика, и ничего не срабатывает в бэктесте.
Вебхук отправляет те же события в формате JSON на любой адрес, который вы выберете — торговому боту, журналу, ретранслятору, автоматическому процессу. Он остаётся выключенным, пока вы не введёте адрес, дублирование по событию на бар исключено, ограничение — двадцать сообщений в минуту, а сбой записывается в лог, а не выбрасывается. Отправка происходит через собственный сетевой сервис cTrader, поэтому индикатор не требует прав на доступ к файлам или сети.
ТИП И ОКНО
Индикатор-оверлей: всё рисуется на ценовом графике, отдельное окно не добавляется.
ТАЙМФРЕЙМЫ И ИНСТРУМЕНТЫ
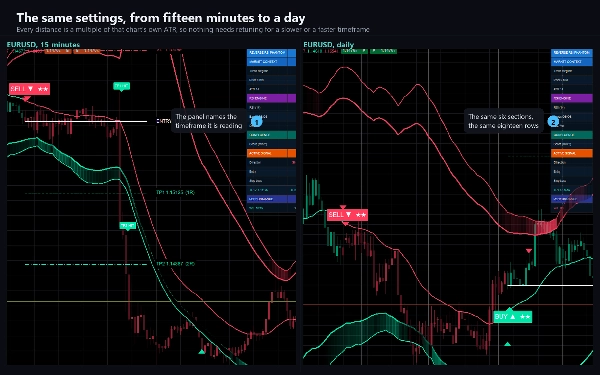
Любые. Любое расстояние, которое он рисует, является кратным собственному ATR этого графика, а цены форматируются под тик вашего брокера, поэтому не требуется перенастройка между пятнадцатиминутным и дневным графиком или между валютной парой с пятью десятичными знаками и золотом с четырьмя цифрами. Диапазон от M15 до H4 — это тот, на котором проводилось большинство тестов.
Требуется объём: один из пяти слоёв конвергенции его читает.
СЛУЧАИ ИСПОЛЬЗОВАНИЯ
- Чтение давления перекупленности и перепроданности там, где оно должно быть, на ценовой шкале.
- Входы на откат к среднему на полосе с режимом тренда в качестве фильтра.
- Превращение сигнала в план: один стоп и три цели, нарисованные до вашего действия.
- Наблюдение за одним графиком с уведомлениями по строке лога, звуку, электронной почте или вебхуку, когда что-то происходит.
ДЛЯ КОГО ОН
Трейдеры, которые уже используют RSI и хотят видеть его там, где находятся их глаза, и все, кто хочет, чтобы сигнал сопровождался стопом и набором целей, а не просто стрелкой.
ПРОБНАЯ ВЕРСИЯ
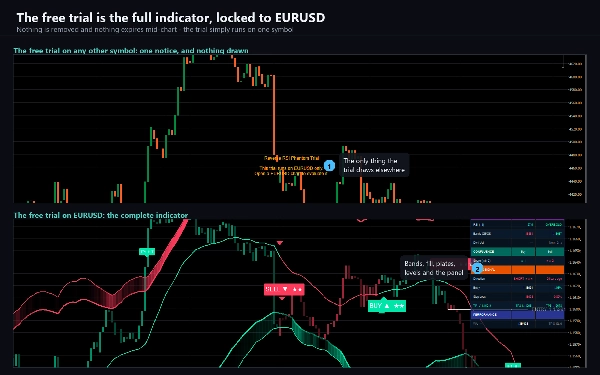
Бесплатная пробная версия — это полный индикатор только для EURUSD — любой суффикс брокера работает. На любом другом символе показывается уведомление и ничего не рисуется. Нет ограничения по времени, нет сокращённой истории, нет отсутствующих функций. Полная версия снимает ограничение по символу и больше ничего не меняет.
ТЕХНИЧЕСКИЕ ЗАМЕТКИ И ОГРАНИЧЕНИЯ
Права доступа: отсутствуют. Индикатор не может читать файлы, запускать процессы или открывать соединения самостоятельно.
Это инструмент для построения графиков и анализа. Он не размещает ордера и не имеет доступа к вашему счёту.
Строка ПРОИЗВОДИТЕЛЬНОСТИ панели считает, что произошло на барах, загруженных на вашем графике с текущими настройками. Это описание этой истории, а не бэктест и не прогноз.
Отключение фильтра подтверждения повышает балл конвергенции, а не снижает его — три из пяти слоёв дают очко, когда их фильтр отключён. Повышайте минимальный балл соответственно, если отключаете фильтры.
ПОДДЕРЖКА
Вопросы задавайте через вкладку Обсуждение. Указывайте вашего брокера, символ, таймфрейм, версию cTrader и скриншот, и вы получите полезный ответ с первого раза.
Торговля связана с риском. Прошлые результаты не гарантируют будущих.
Сводка
Key features include:
- Two price bands representing RSI thresholds with gradient fills indicating pressure intensity.
- A midline and candle tinting reflecting the current trend regime.
- Confluence-scored BUY and SELL signals displayed on signal bars with a score out of five.
- A comprehensive trade plan per signal, showing entry, an ATR-based stop loss, and three customizable profit targets.
- Visual markers for trend regime changes and RSI-price divergences.
- An 18-row informational panel summarizing regime, ATR, RSI states, volume, confluence, active trades, and historical performance.
- Configurable settings covering RSI parameters, smoothing, trend filters, confluence thresholds, stop modes, risk targets, divergence lookback, and alert/webhook options.
The indicator operates as an overlay on any instrument and timeframe, requiring volume data for full functionality. Alerts and webhooks can notify users of key events such as signals, trend shifts, targets, and stops. Non-repaint mode ensures signals are fixed once bars close. It is designed for traders who use RSI and seek integrated signals with trade management guidance.
Отзывы покупателей
5 | 100 % | |
4 | 0 % | |
3 | 0 % | |
2 | 0 % | |
1 | 0 % |