
Расширенный индикатор зон Дончиана для cTrader
Освойте рыночные тренды и прорывы с точностью!
Поднимите свою торговлю на новый уровень с Расширенным индикатором зон Дончиана – мощным инструментом, созданным для трейдеров, которые требуют точности, гибкости и эффективности. Этот индикатор нового поколения улучшает классические каналы Дончиана, вводя анализ на нескольких таймфреймах, настраиваемые расчёты цены, оповещения в реальном времени и визуализацию облаков.
Независимо от того, торгуете ли вы форексом, акциями или товарами, Расширенный индикатор зон Дончиана предоставляет вам инструменты для выявления прорывов, следования трендам и торговли разворотами, как профессионал.
Ключевые особенности и преимущества:
1. Зоны Дончиана на нескольких таймфреймах
- Анализируйте зоны Дончиана с более высокого таймфрейма, торгуя на более низком, чтобы всегда быть в согласии с крупным рыночным трендом.
- Идеально подходит для дейтрейдеров и свинг-трейдеров, стремящихся оптимизировать входы и выходы.
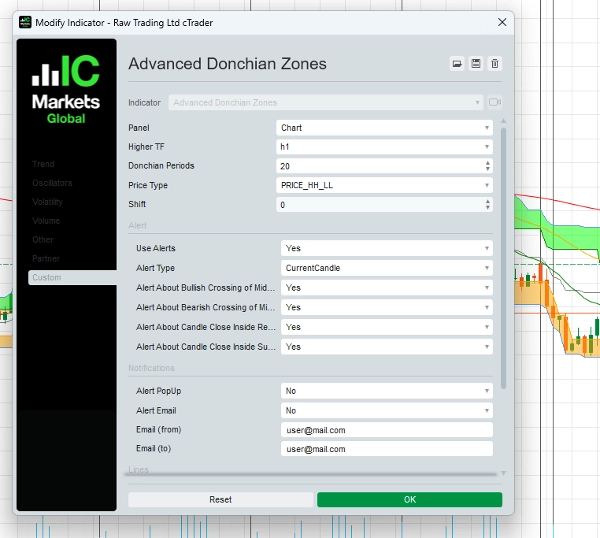
2. Настраиваемый расчет цены
- Выбирайте из пяти продвинутых типов цены для уточнения вашей стратегии:
-
- Максимум / Минимум
- Среднее значение High/Open или High/Close
- Максимум открытия / Минимум открытия
- Максимум закрытия / Минимум закрытия
- Адаптируйте индикатор под ваш стиль торговли и управление рисками.
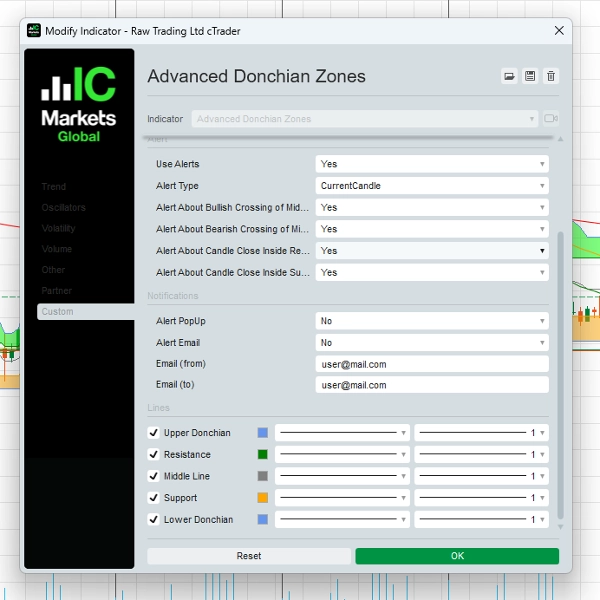
3. Динамические оповещения – никогда не пропустите возможность!
- Получайте уведомления в реальном времени при ключевых торговых событиях:
-
- Пересечения средней линии (бычьи или медвежьи сигналы)
- Закрытие цены внутри ключевых зон (возможные зоны разворота или прорыва)
- Оповещения доступны через всплывающие окна и электронную почту, позволяя вам быть впереди рыночных движений.
4. Визуализация облаков для ясного понимания
- Уникальные затенённые зоны между уровнями Дончиана помогают трейдерам быстро и эффективно визуально определять уровни поддержки, сопротивления и зоны прорыва.
5. Гибкий параметр сдвига
- Регулируйте позиционирование зон Дончиана вперёд или назад во времени для точной настройки вашей торговой стратегии.
6. Простой в использовании интерфейс
- Создан для трейдеров всех уровней, с интуитивно понятным расположением элементов и настраиваемыми параметрами под ваши торговые предпочтения.
Как использовать Расширенный индикатор зон Дончиана
1. Стратегия торговли прорывов – ловите взрывные движения!
- Настройка:
-
- Примените Расширенный индикатор зон Дончиана на ваш график.
- Выберите период Дончиана (например, 20) и более высокий таймфрейм (например, 1H или 4H) для более точных сигналов.
- Вход:
-
- Покупка, когда цена пробивает и закрывается выше верхней зоны Дончиана.
- Продажа, когда цена пробивает и закрывается ниже нижней зоны Дончиана.
- Выход:
-
- Используйте среднюю линию или противоположную зону Дончиана как уровень выхода.
- Пример:
-
- Если торгуете на 15-минутном графике, установите расчет Дончиана на основе 1-часового таймфрейма. Когда цена пробивает верхний уровень Дончиана, входите в покупку со стоп-лоссом рядом со средней линией.
2. Стратегия следования за трендом – следуйте за рыночным импульсом
- Настройка:
-
- Используйте среднюю линию как фильтр тренда.
- Торгуйте только в направлении преобладающего тренда.
- Вход:
-
- Покупка, когда цена находится выше средней линии и отскакивает от зоны поддержки.
- Продажа, когда цена находится ниже средней линии и отскакивает от зоны сопротивления.
- Выход:
-
- Закрывайте сделку, когда цена пересекает среднюю линию в противоположном направлении.
- Пример:
-
- На 4-часовом графике цена остаётся выше средней линии, подтверждая восходящий тренд. Входите в покупку, когда цена откатывается к зоне поддержки и показывает признаки разворота.
3. Стратегия торговли в диапазоне – прибыль на боковом рынке
- Настройка:
-
- Определяйте периоды, когда цена колеблется между верхними и нижними зонами Дончиана.
- Вход:
-
- Покупка, когда цена приближается к поддержке.
- Продажа, когда цена приближается к сопротивлению.
- Выход:
-
- Фиксируйте прибыль возле противоположной зоны Дончиана или при прорыве.
- Пример:
-
- На 1-часовом графике, если цена колеблется между верхними и нижними уровнями Дончиана, совершайте сделки на этих экстремумах для возможностей возврата к среднему значению.
Почему трейдеры выбирают Расширенный индикатор зон Дончиана
✔ Универсальность для разных стилей торговли – подходит для прорывов, следования за трендом и торговли в диапазоне.
✔ Повышает точность торговли – точно определяйте ключевые уровни поддержки и сопротивления.
✔ Оповещения в реальном времени – оставайтесь информированными с мгновенными уведомлениями.
✔ Профессиональный инструмент – разработан для трейдеров, ищущих преимущество на рынке.
Ценообразование и эксклюзивное предложение
Специальная ограниченная цена: $97 (единовременный платеж)
Включает:
- Расширенный индикатор зон Дончиана для cTrader
- Полное руководство пользователя с пошаговыми стратегиями
- Бесплатные обновления в течение 1 года
- Приоритетная поддержка по электронной почте
Отзывы трейдеров
«Я использую каналы Дончиана уже много лет, но этот индикатор выводит всё на новый уровень. Функция мульти-таймфрейма – это прорыв!»
— Марк С., трейдер форекс
«Оповещения и настраиваемые параметры цены помогают мне увереннее ловить сделки на прорыв. Настоятельно рекомендую серьёзным трейдерам.»
— Лиза Т., свинг-трейдер
Начните сегодня!
Готовы преобразить свою торговлю? Нажмите кнопку ниже, чтобы приобрести Расширенный индикатор зон Дончиана и начать торговать с точностью!
[Купить сейчас за $97]
Гарантия возврата денег в течение 30 дней
Мы уверены в нашем продукте. Если вы не полностью удовлетворены, свяжитесь с нами в течение 30 дней для полного возврата средств – без лишних вопросов.
Нужна помощь? Свяжитесь с нами!
📧 Email: o.elmottaqy@gmail.com
🌐 Вебсайт: https://t.me/mottaqyo
Отказ от ответственности
Торговля связана с риском. Расширенный индикатор зон Дончиана является инструментом для поддержки ваших торговых решений, но не гарантирует прибыль. Всегда используйте правильное управление рисками и торгуйте ответственно.
5 | 50 % | |
4 | 50 % | |
3 | 0 % | |
2 | 0 % | |
1 | 0 % |


