Trend Strength Signals St3llars33r
Gösterge
Sürüm 1.0, Aug 2025
Windows, Mac
Başlangıç 26/05/2025
451.48M
İşlem hacmi
61.16K
Kazanılan pip
15
Satışlar
1.43K
Ücretsiz yüklemeler
Açıklama
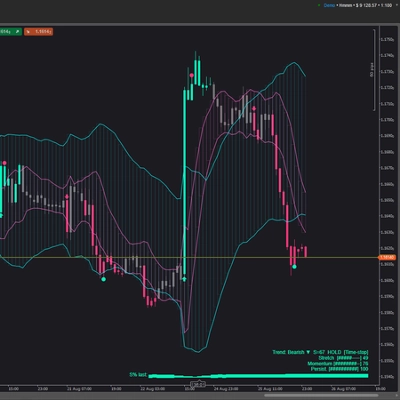
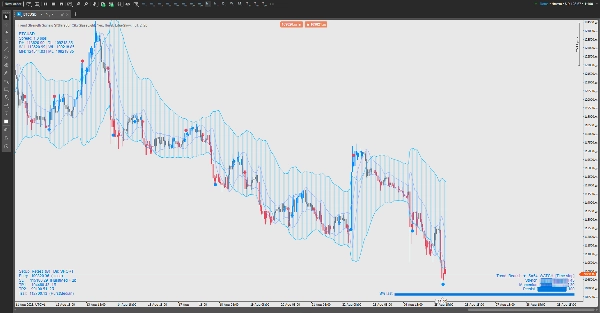
Rejimi, zamanlamayı ve riski bir bakışta göstermek için volatilite zarfını döngü farkında bir kanal ile harmanlayan trend ticareti için görsel bir araç seti. Herhangi bir arka planda (açık/koyu) okunabilir olacak şekilde tasarlanmıştır ve ekranda temizliği korurken size “sonraki ne yapmalı” ipuçları verir.
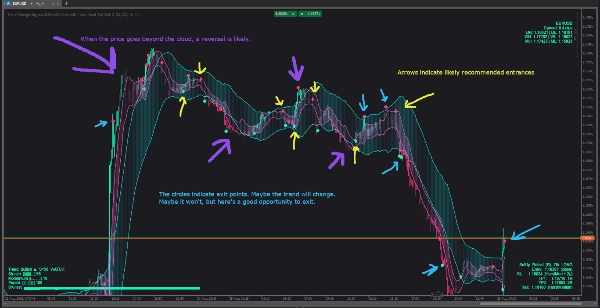
Grafikte gördükleriniz
- Bulutlar (açılıp kapatılabilir):
-
- Piyasa aktivitesi ile genişleyen/sıkışan bir volatilite bulutu.
- Fiyatın sürekli ritmini takip eden bir döngü bulutu.
- İsterseniz birini, ikisini veya hiçbiri gösterebilirsiniz.
- Sinyaller: potansiyel trend değişimleri için göze batmayan yukarı/aşağı oklar; kar almayı teşvik eden küçük noktalar.
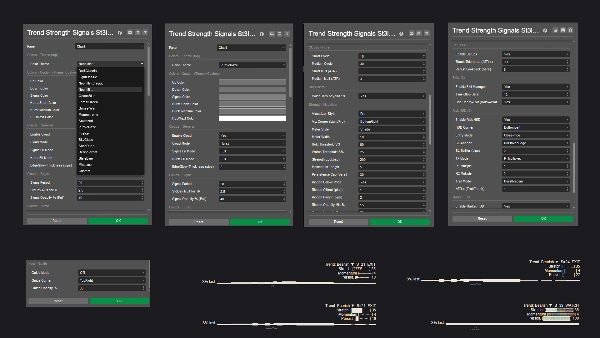
- Trend Gücü HUD (üç stil):
-
- Hafif — kompakt bir durum etiketi.
- Pro — üç ölçer (gerilme, momentum, süreklilik) ve küçük bir geçmiş kıvılcımı içeren küçük bir gösterge paneli.
- Şerit — fiyatın yakınında yumuşak bir çubuk, yoğunluğu trend gücünü takip eder.
- Risk HUD: bir yön önerir, koruyucu bir durdurma alanı, iki katmanlı kar hedefi ve isteğe bağlı bir takip fikri sunar. Seçtiğiniz herhangi bir köşede durur ve bar gelişirken güncellenir.
- Piyasa HUD: sembol ve spread, ayrıca gün/hafta/ay yüksek-düşük referansları, böylece her zaman daha büyük harita içinde nerede olduğunuzu bilirsiniz.
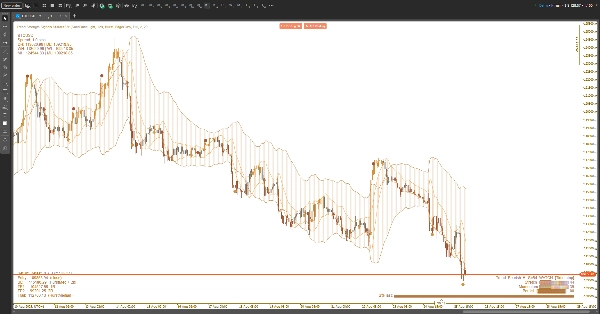
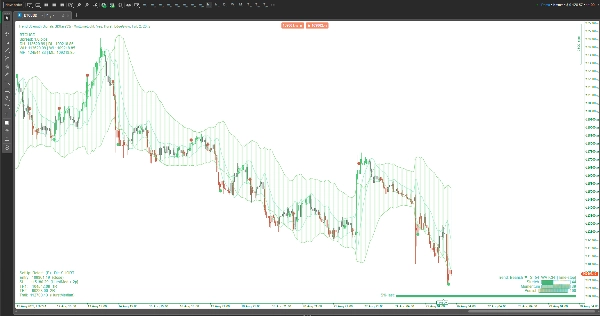
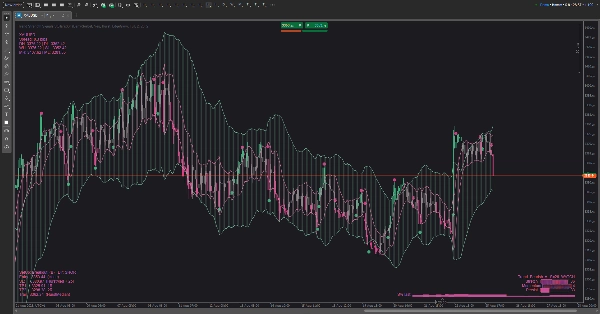
- Temalar: açık ve koyu grafikler için seçilmiş renk setleri (ve Özel mod). Tüm grafik öğeleri—HUD’lar ve sinyaller dahil—aktif temayı takip eder.
Nasıl kullanılır (pratik, teknik değil)
- Bulut görünümünüzü seçin:
-
- Sıkışmaları ve genişlemeleri görmek için volatilite bulutunu kullanın.
- “Kenar” ve “orta” dönüşleri değerlendirmek için döngü bulutunu kullanın.
- Bağlam + zamanlama istiyorsanız ikisini de kullanın.
- Trend Gücünü okuyun:
-
- Durum TUT seviyesine yükseldiğinde, mevcut yönle işlem yapın; İZLE seviyesine düştüğünde agresifliği azaltın; ÇIKIŞ gösterdiğinde, yeni işlemlerden kaçının veya riski sıkılaştırın.
- Pro modunda, yükselen ölçerler + yükselen kıvılcım çizgisi = kalite artışı; azalan ölçerler = riski azaltın.
- Fiyat ve bulut ile girişleri zamanlayın:
-
- Sıkışma sonrası kırılmalar, buluta nazik bir geri çekilme sonrası yeniden girişler veya dış kenardan sıçramalar temel desenlerdir.
- Eğer erken bir ok bar ortasında belirip sonra kaybolursa, daha az yanıltıcı sinyal tercih ediyorsanız bar kapanış onayını bekleyin.
- İşlemi Risk HUD ile yönetin:
-
- Koruyucu durdurmayı HUD’un vurguladığı en yakın yapısal sınırın biraz ötesine yerleştirin.
- TP1’de kademeli çıkış yapın, kalan kısmı TP2’ye hedefleyin veya önerilen takip çizgisini izleyin.
- Trend Gücü güçlüden zayıfa düşerse, daha erken çıkmayı düşünün.
- Durumsal filtreler:
-
- Bulutlar ince ve dalgalı olduğunda veya güç durumu ÇIKIŞ’ta olduğunda girişlerden kaçının.
- Güç artarken, bulut eğimli ve fiyat kenarlarla temiz etkileşimdeyken işlemleri tercih edin.
Özelleştirme
- Çalışma alanınıza uyacak şekilde HUD köşelerini, görselleştirme stilini ve renk temasını değiştirin.
- Açık temalar beyaz arka planda metni görünür tutar; okyanus/orman/günbatımı paletleri parlama olmadan ince kontrast ekler.
Ne değildir
Bu bir kara kutu otomatik işlemci değildir. Karar destek aracıdır: trend kalitesini çerçeveler, mantıklı risk yerleri önerir ve yüksek olasılıklı anları vurgular—ama kontrol sizde kalır.
Özet
Gösterge profili
Müşteri değerlendirmeleri
0.0
Değerlendirmeler: 0
Müşteri değerlendirmeleri
Bu ürün için henüz bir değerlendirme yok. Ürünü denediniz mi? O zaman ona dair görüşlerini paylaşan ilk kişi olun!
Tartışma
SSS
cTrader Store üzerinden erişilebilen işlem botları, göstergeler ve eklentiler gibi ürünler, üçüncü taraf sağlayıcılar tarafından sağlanır ve yalnızca bilgilendirme ve teknik erişim amaçlarıyla sunulur. cTrader Store bir broker değildir ve yatırım tavsiyesi, kişisel öneriler vermez veya gelecekteki performansı garanti etmez.


Fiyat
Başlangıç 26/05/2025
451.48M
İşlem hacmi
61.16K
Kazanılan pip
15
Satışlar
1.43K
Ücretsiz yüklemeler