
설명
캔들 압력 지수(CPI)는 각 캔들 뒤에 숨겨진 매수 및 매도 압력을 드러내기 위해 설계된 강력하면서도 사용하기 쉬운 지표입니다. 단순히 가격이 상승했는지 하락했는지를 보여주는 대신, CPI는 각 캔들 내에서 매수자와 매도자가 시장을 얼마나 강하게 지배했는지를 더 깊이 파고듭니다. 이는 추세 강도를 식별하고, 조기 반전을 포착하며, 진입 또는 종료 지점을 더 높은 정확도로 확인하는 데 독특한 도구가 됩니다.
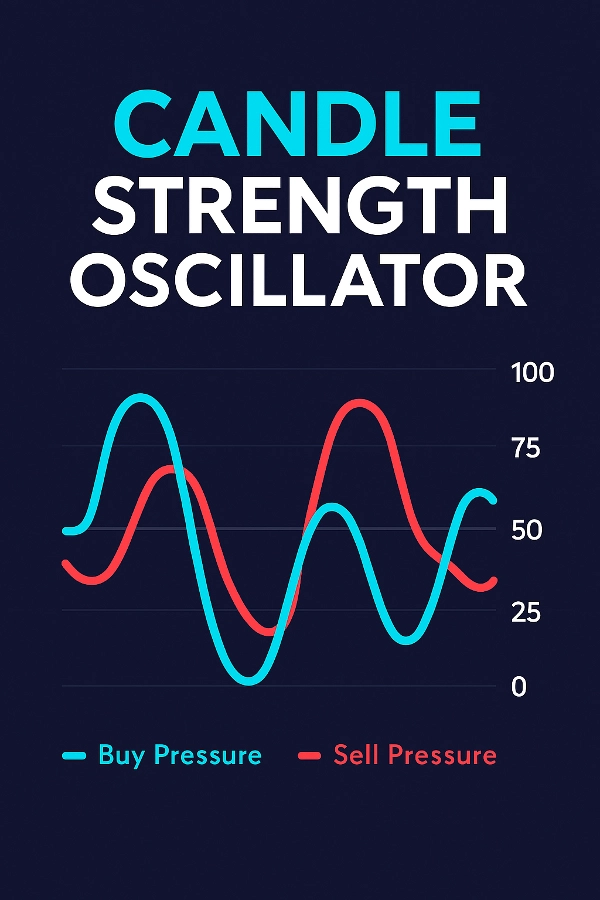
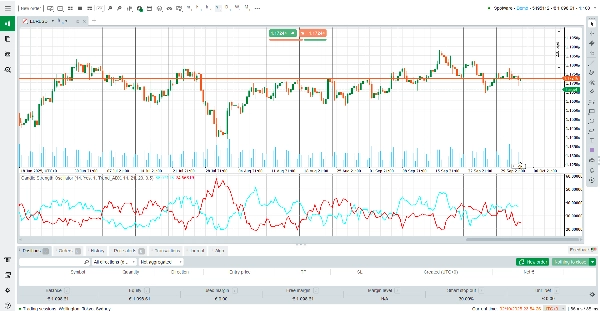
가격에만 반응하는 전통적인 오실레이터와 달리, CPI는 캔들 몸체 역학, 모멘텀, 거래량 가중치, 추세 분석(ADX 또는 EMA)을 결합하여 시장 압력에 대한 포괄적인 시각을 제공합니다. 두 개의 부드러운 선 – 매수 압력(청록색)과 매도 압력(빨간색) – 을 통해 트레이더는 즉시 시장의 어느 쪽이 지배적인지 알 수 있습니다.
지표 읽는 방법
매수 압력(청록색 선) – 강세 지배력의 강도를 나타냅니다. 선이 상승하면 매수자의 지배력이 증가함을 보여줍니다.
매도 압력(빨간색 선) – 약세 지배력의 강도를 나타냅니다. 선이 상승하면 매도 세력이 강해짐을 보여줍니다.
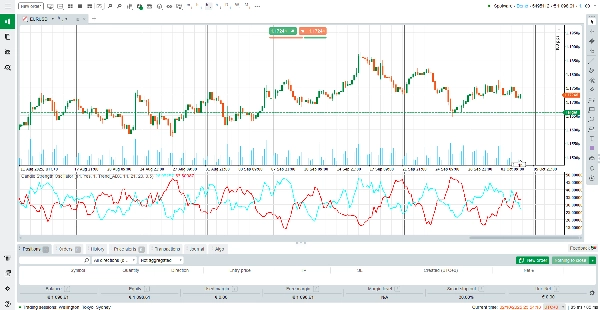
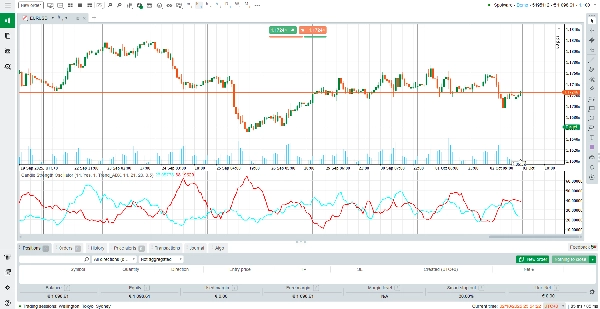
교차점 – 매수 선이 매도 선 위로 교차할 때, 이는 강한 매수 압력(잠재적 매수 기회)을 신호합니다. 매도 선이 위로 교차할 때는 약세 압력이 지배적임(잠재적 매도 기회)을 나타냅니다.
50 레벨 구역 – 중간(약 50) 근처의 수치는 매수자와 매도자 간의 균형을 나타내며, 극단적인 수치(75 이상 또는 25 이하)는 강한 방향성 압력을 보여줍니다.
추세 요인 부스트 – 이 지표는 ADX 또는 EMA 기울기에서 추세 확인을 기반으로 신호를 조정하여 횡보장 동안 잘못된 신호를 줄입니다.
지표 작동 방식
CPI는 다음을 고려한 가중 모델을 사용하여 압력을 계산합니다:
캔들 구조: 몸체 크기와 고가/저가 대비 종가 위치.
모멘텀: 이전 캔들과 비교한 가격 움직임.
거래량: 틱 거래량 가중치를 통해 고거래량 움직임에 더 큰 중요성을 부여합니다.
추세 확인: ADX 강도 또는 EMA 기울기가 부스트 요인을 추가하여 신호를 현재 추세와 일치시킵니다.
스무딩: 사용자 정의 SMA 필터를 사용하여 반응성을 잃지 않으면서 부드럽고 안정적인 선을 보장합니다.
이 고급 공식 덕분에 CPI는 단순히 가격에 반응하는 것뿐만 아니라 가격이 움직이는 이유를 이해하여 트레이더에게 시장 행동에 대한 더 깊은 통찰을 제공합니다.
주요 특징
이중 선 시각화 – 색상으로 구분된 선(매수자는 청록색, 매도자는 빨간색)으로 매수와 매도 압력을 즉시 비교할 수 있습니다.
적응형 추세 부스트 – ADX 또는 EMA를 통합하여 추세 방향을 확인하고 잘못된 신호를 줄입니다.
거래량 인식 계산 – 틱 거래량으로 가중치를 부여하여 실제 시장 참여에 기반한 움직임을 강조합니다.
부드럽고 깔끔한 표시 – 내장된 SMA 필터로 지연 없는 부드러운 판독값을 제공합니다.
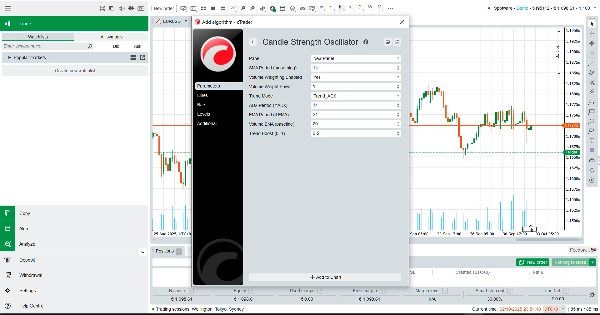
완전한 사용자 정의 가능 – 기간, 가중치, 부스트 강도를 조절하여 모든 거래 스타일에 맞출 수 있습니다.
왜 캔들 압력 지수를 사용해야 하나요?
CPI는 단순한 가격 움직임을 넘어 매수자와 매도자 간의 진정한 싸움을 보고자 하는 트레이더에게 완벽합니다. 스캘퍼, 스윙 트레이더, 추세 추종자 등 누구든 이 무료 지표를 통해 진입 타이밍을 맞추고, 리스크를 관리하며, 시장의 실제 방향에 맞춰 거래할 수 있는 명확성을 얻을 수 있습니다.
오늘 캔들 압력 지수(CPI)를 다운로드하고, 각 캔들을 움직이는 숨겨진 힘을 이해하며 자신감을 가지고 거래하세요.
요약
The indicator displays two smooth lines: Buy Pressure (cyan) and Sell Pressure (red). Crossovers between these lines signal shifts in market dominance, helping traders identify trend strength, potential reversals, and optimal entry or exit points. Readings near the midpoint indicate balance, while extremes suggest strong directional pressure.
CPI incorporates volume-weighted calculations and trend-based boosts to reduce false signals during sideways markets. It includes a smoothing filter for stable, responsive readings and offers customization of periods, weighting, and trend boost intensity.
This tool is applicable across various markets including Forex, commodities, stocks, and cryptocurrencies, supporting trading strategies such as scalping and breakout trading. It aims to provide traders with enhanced insight into market dynamics beyond simple price action.
고객 리뷰
5 | 0 % | |
4 | 100 % | |
3 | 0 % | |
2 | 0 % | |
1 | 0 % |


!["[Stellar Strategies] QQE" 로고](https://cdn.ctrader.com/image/webp/e702104a-874c-4b39-97dd-fb34518d1015_27712)


