
Dynamic Trend Flux
อินดิเคเตอร์
เวอร์ชัน 1.0, Nov 2025
Windows, Mac
4.0
รีวิว: 1
คำอธิบาย
Dynamic Trend Flux
ประเภท: ตัวแกว่งโมเมนตัม / แนวโน้ม (สไตล์ MACD, หลายสี)
สิ่งที่มันทำ
Dynamic Trend Flux คือ ตัวแกว่งโมเมนตัมที่มีสี ที่อิงจากความแตกต่างของ EMA แบบเร็ว/ช้าแบบคลาสสิกพร้อมเส้นสัญญาณ
ช่วยให้คุณเห็นได้อย่างรวดเร็ว:
- เมื่อ โมเมนตัมเป็นขาขึ้นหรือลง,
- ว่าโมเมนตัม กำลังแข็งแกร่งขึ้นหรือลดลง,
- และที่ที่ แนวโน้มเปลี่ยนแปลง เกิดขึ้น (การตัดกันของเส้นหลักกับเส้นสัญญาณ)
ตัวบ่งชี้วาด:
- เส้นหลัก (เส้น Flux)
-
- สร้างจากความแตกต่างระหว่าง EMA แบบเร็วและช้า
- เปลี่ยนสีขึ้นอยู่กับว่าอยู่ เหนือหรือต่ำกว่า เส้นสัญญาณ (ไม่บังคับ)
- เส้นสัญญาณ
-
- ค่าเฉลี่ยเคลื่อนที่ของเส้นหลัก ใช้เป็น ตัวกระตุ้นที่เรียบกว่า.
- ฮิสโตแกรม 4 สี (ไม่บังคับ)
-
- แสดงระยะห่างระหว่างเส้นหลักและเส้นสัญญาณ,
- สีแสดงทั้ง ทิศทาง (เหนือ/ต่ำกว่า ศูนย์) และ การเปลี่ยนแปลงของความแข็งแกร่ง จากแท่งหนึ่งไปอีกแท่งหนึ่ง.
- จุดที่ตัดกัน (ไม่บังคับ)
-
- เน้นจุดที่เส้นหลักตัดกับเส้นสัญญาณ → การเปลี่ยนแปลงช่วงแนวโน้ม ที่เป็นไปได้.
การคำนวณทั้งหมดทำบน กรอบเวลาปัจจุบันของแผนภูมิ.
วิธีอ่าน
1. เส้นศูนย์
- ค่าที่ เหนือศูนย์ → แรงกดดันขาขึ้นมีอำนาจเหนือกว่า.
- ค่าที่ ต่ำกว่าศูนย์ → แรงกดดันขาลงมีอำนาจเหนือกว่า.
2. ฮิสโตแกรมสี
เมื่อเปิดโหมด 4 สี:
- สีฟ้าอมเขียว → เหนือศูนย์และกำลังเพิ่มขึ้น
-
- โมเมนตัมขาขึ้นที่แข็งแกร่ง / เพิ่มขึ้น.
- สีน้ำเงิน → เหนือศูนย์แต่ลดลง
-
- แนวโน้มขาขึ้นยังคงอยู่ แต่โมเมนตัม เย็นลง.
- สีแดง → ต่ำกว่าศูนย์และลดลง
-
- โมเมนตัมขาลงที่แข็งแกร่ง / เพิ่มขึ้น.
- สีเลือดหมู → ต่ำกว่าศูนย์แต่กำลังเพิ่มขึ้น
-
- ช่วงขาลงยังคงอยู่ แต่โมเมนตัม สูญเสียความแข็งแกร่ง.
สิ่งนี้ทำให้การสังเกตความแตกต่างและการเปลี่ยนแปลงโมเมนตัมง่ายขึ้นมากด้วยสายตา.
3. เส้นหลัก & เส้นสัญญาณ
- เส้นหลัก เหนือ เส้นสัญญาณ → ช่วงขาขึ้น.
- เส้นหลัก ต่ำกว่า เส้นสัญญาณ → ช่วงขาลง.
ถ้าเปิดใช้งานการเปลี่ยนสี:
- เส้นหลัก สีเขียวมะนาว = เหนือเส้นสัญญาณ (ควบคุมโดยขาขึ้น)
- เส้นหลัก สีแดง = ต่ำกว่าเส้นสัญญาณ (ควบคุมโดยขาลง)
4. จุดตัด
- จุดสีเขียว (ตัดขึ้น) → เส้นหลักตัด เหนือ เส้นสัญญาณ
-
- เป็นไปได้ที่จะเริ่มต้น สวิงขาขึ้น.
- จุดสีแดง (ตัดลง) → เส้นหลักตัด ต่ำกว่า เส้นสัญญาณ
-
- เป็นไปได้ที่จะเริ่มต้น สวิงขาลง.
ควรรวมสัญญาณเหล่านี้กับโครงสร้าง / การเคลื่อนไหวของราคา และบริบทของกรอบเวลาที่สูงกว่าเสมอ.
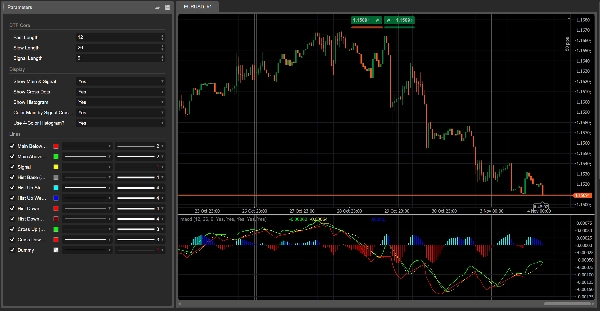
พารามิเตอร์ (ภาษาอังกฤษ)
แกนหลัก DTF
- ความยาวเร็ว – ช่วงของ EMA แบบเร็ว (ค่าเริ่มต้น 12).
- ความยาวช้า – ช่วงของ EMA แบบช้า (ค่าเริ่มต้น 26).
- ความยาวสัญญาณ – ช่วงของ SMA สัญญาณที่ใช้กับเส้นหลัก (ค่าเริ่มต้น 9).
การแสดงผล
- แสดงเส้นหลัก & สัญญาณ – สลับการแสดงสองเส้นนี้.
- แสดงจุดตัด – แสดงจุดบนการตัดกันของเส้นหลัก/สัญญาณ.
- แสดงฮิสโตแกรม – สลับการแสดงฮิสโตแกรมด้านหลัง.
- เปลี่ยนสีเส้นหลักตามการตัดสัญญาณ?
-
- เปิด → เส้นหลัก สีเขียวมะนาว เหนือสัญญาณ, สีแดง ต่ำกว่า.
- ปิด → เส้นหลักยังคงเป็น สีแดง.
- ใช้ฮิสโตแกรม 4 สี?
-
- เปิด → ใช้ตรรกะสี aqua / น้ำเงิน / แดง / เลือดหมู.
- ปิด → ฮิสโตแกรมเป็นสี เทา เดียว.
สรุป
โปรไฟล์อินดิเคเตอร์
รีวิวจากลูกค้า
4.0
รีวิว: 1
5 | 0 % | |
4 | 100 % | |
3 | 0 % | |
2 | 0 % | |
1 | 0 % |
การสนทนา
คำถามที่พบบ่อย
Signal
Indices
Commodities
GBPUSD
RSI
Bollinger
Fibonacci
Scalping
AI
XAUUSD
NAS100
MACD
BTCUSD
Forex
Breakout
EURUSD
NZDUSD
Martingale
Prop
ZigZag
Supertrend
Fair Value Gap
SMC
Crypto
Grid
Stocks
ATR
USDJPY
VWAP
ผลิตภัณฑ์ที่มีให้บริการผ่าน cTrader Store รวมถึงบอทการเทรด อินดิเคเตอร์ และปลั๊กอิน มีให้บริการโดยนักพัฒนาบุคคลที่สามและมีไว้เพื่อวัตถุประสงค์ในการเข้าถึงข้อมูลและทางเทคนิคเท่านั้น cTrader Store ไม่ใช่โบรกเกอร์และไม่ได้ให้คำแนะนำการลงทุน คำแนะนำส่วนบุคคล หรือการรับประกันผลการดำเนินงานในอนาคต


ราคา
42.11M
ปริมาณการเทรด
6.13M
Pips ที่ได้กำไร
222
การขาย
8.39K
ติดตั้งฟรี