คำอธิบาย
📈 ตัวบ่งชี้อคติความผันผวน Skew – เวอร์ชันมืออาชีพ (สำหรับ cTrader)
ปลดล็อกความเข้าใจที่ลึกซึ้งยิ่งขึ้นเกี่ยวกับแรงกดดันของตลาด ความไม่สมดุลของความผันผวน และความเชื่อมั่นในทิศทางด้วย ตัวบ่งชี้อคติความผันผวน Skew เวอร์ชันที่ปรับปรุงจากแนวทางคลาสสิกที่อิงตามความผันผวนซึ่งได้รับแรงบันดาลใจจาก Pine Script และตอนนี้ได้รับการปรับแต่งอย่างเต็มที่สำหรับ cTrader.
เครื่องมือนี้ช่วยให้นักเทรดเห็นภาพ ฝ่ายใดของตลาดที่มีแรงกระแทกมากกว่า — ผู้ซื้อหรือผู้ขาย — โดยการวัดความไม่สมมาตรของความผันผวนและแปลงเป็นสัญญาณที่ชัดเจนและอ่านง่าย
ไม่ว่าคุณจะเทรดดัชนี ฟอเร็กซ์ สินค้าโภคภัณฑ์ หรือคริปโต ตัวบ่งชี้นี้ทำหน้าที่เป็น ตัวกรองแนวโน้ม ตัวตรวจจับสภาวะ และเครื่องมือยืนยันอคติ ที่ทรงพลัง
1. ตัวบ่งชี้ Skew วัดอะไร
ตัวบ่งชี้ประเมิน ความสมดุลของความผันผวน ระหว่างแท่งเทียนขาขึ้นและขาลง
มันคำนวณช่วงจริงที่เป็นมาตรฐานและป้อนเข้าสู่ค่าเฉลี่ยปรับตัวสองค่า:
- Deviation Max → ความผันผวนที่เกิดขึ้นใน แท่งเทียนขาขึ้น
- Deviation Min → ความผันผวนที่เกิดขึ้นใน แท่งเทียนขาลง
จากนั้นมันคำนวณ:
👉 Skew = DeviationMax / DeviationMin
ซึ่งแปลงความผันผวนดิบเป็นการอ่านทิศทางที่ชัดเจน:
- Skew > 1 → การเคลื่อนไหวขึ้นมีความแข็งแกร่งมากกว่าโดยเฉลี่ย
- Skew < 1 → การเคลื่อนไหวลงมีความแข็งแกร่งกว่า
- Skew ≈ 1 → ความผันผวนสมมาตรและตลาดสมดุล
โดยสรุป:
Skew เปิดเผยฝ่ายที่มี “ความโดดเด่นของความผันผวน”.
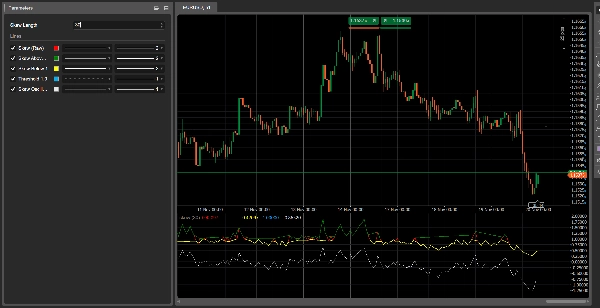
2. การทำความเข้าใจเส้นต่างๆ
1. Skew (ดิบ) – เส้นสีแดง
อัตราส่วนความผันผวนบริสุทธิ์ นี่คือสัญญาณหลัก
2. Skew เหนือ 1 – เส้นสีเขียว
แสดงความโดดเด่นของความผันผวนขาขึ้น
3. Skew ต่ำกว่า 1 – เส้นสีเหลือง
แสดงความโดดเด่นของความผันผวนขาลง
4. เส้นเกณฑ์ 1.0 – เส้นประสีน้ำเงิน
แทนความสมดุล
5. Skew Oscillator (log) – เส้นสีขาว
การแสดงผลที่เสถียรและเรียบเนียนมากขึ้น:
- เหนือ 0 = ความผันผวนขาขึ้น
- ต่ำกว่า 0 = ความผันผวนขาลง
3. วิธีการอ่าน
A) สภาวะตลาด
🔹 สภาวะขาขึ้น
- Skew > 1
- เส้นสีเขียวทำงาน
- Oscillator เหนือศูนย์
→ ตลาดเอื้อต่อ การซื้อ.
🔹 สภาวะขาลง
- Skew < 1
- เส้นสีเหลืองทำงาน
- Oscillator ต่ำกว่าศูนย์
→ ตลาดเอื้อต่อ การขาย.
🔹 เป็นกลาง
- Skew ≈ 1
→ ตลาดสมดุล เหมาะสำหรับการเทรดในช่วงแนวระนาบ
4. สัญญาณการเปลี่ยนแปลงสภาวะตลาด
Skew ข้ามขึ้นเหนือ 1
→ ผู้ซื้อได้ความโดดเด่นของความผันผวน
→ การเปลี่ยนแปลงเป็นขาขึ้น
Skew ข้ามลงต่ำกว่า 1
→ ผู้ขายได้ความโดดเด่นของความผันผวน
→ การเปลี่ยนแปลงเป็นขาลง
การเปลี่ยนแปลงเหล่านี้มักเกิดขึ้น ก่อน การเคลื่อนไหวของราคาได้รับการยืนยันแนวโน้ม ทำให้ Skew เป็นตัวบ่งชี้ล่วงหน้าที่ทรงพลัง
5. กรณีการใช้งานจริง
1️⃣ ตัวกรองแนวโน้มสำหรับ cBots
- เทรดยาวเฉพาะเมื่อ SkewOsc > 0
- เทรดสั้นเฉพาะเมื่อ SkewOsc < 0
2️⃣ การยืนยันคุณภาพแนวโน้ม
- แนวโน้มขาขึ้น + Skew > 1 = แนวโน้มแข็งแกร่ง
- แนวโน้มขาขึ้น + Skew ลดลงสู่ 1 = แนวโน้มอ่อนแรง
3️⃣ ความรู้สึกตลาด / ตัวกรองความเสี่ยง
มีประสิทธิภาพเป็นพิเศษกับดัชนีและคู่สกุลเงินหลักของ FX
6. สรุป
- สิ่งที่แสดง: ความโดดเด่นของความผันผวน
- เหตุผลที่สำคัญ: การเปลี่ยนแปลงของความผันผวนเกิดก่อนการเปลี่ยนแปลงของราคา
- วิธีใช้: เป็นตัวกรอง เครื่องมือยืนยัน หรือเกจวัดความรู้สึก
- ส่วนที่ดีที่สุด: น้ำหนักเบามาก เร็ว และปรับตัวได้ดี
สรุป
รีวิวจากลูกค้า
5 | 67 % | |
4 | 33 % | |
3 | 0 % | |
2 | 0 % | |
1 | 0 % |


