


คำอธิบาย
แนวคิด
ค่าเฉลี่ยเคลื่อนที่ที่ เริ่มจากจุดราคาที่เลือก แทนที่จะบังคับให้การวิเคราะห์ทุกครั้งอยู่ในช่วงเวลาย้อนหลังที่กำหนดไว้
ปัญหา
ค่าเฉลี่ยเคลื่อนที่แบบดั้งเดิมถูกกำหนดโดยช่วงเวลา
20 แท่ง 50 แท่ง 200 แท่ง
แต่บางครั้งคำถามที่สำคัญไม่ใช่ จำนวนแท่งเท่าไหร่ ที่คุณต้องการวัด
แต่เป็น จุดเริ่มต้นของการวัด
ช่วงเวลาคงที่จะมองย้อนหลังจากแท่งปัจจุบัน แต่ไม่รู้ว่าเหตุการณ์ราคาตัวใดสำคัญต่อการวิเคราะห์ของคุณ
ถ้าการแก้ไขเริ่มที่นี่ หรือแรงกระตุ้นเริ่มที่นั่น ค่าเฉลี่ยเคลื่อนที่ 50 ช่วงเวลาไม่สามารถบอกได้ว่า:
"เริ่มวัดจากเหตุการณ์นี้"
ช่วงเวลากำหนดหน้าต่างการวัด
แต่ไม่กำหนดจุดเริ่มต้น
แนวคิดหลัก: จุดยึดกำหนดจุดเริ่มต้น ค่าเฉลี่ยเคลื่อนที่วัดจากจุดนั้น
ค่าเฉลี่ยเคลื่อนที่แบบลากจุดยึดได้เปลี่ยนจุดอ้างอิง
ค่าเฉลี่ยเคลื่อนที่แบบดั้งเดิมใช้ ช่วงเวลา เป็นจุดอ้างอิงหลัก
ค่าเฉลี่ยเคลื่อนที่แบบลากจุดยึดได้ใช้ จุดเริ่มต้น เป็นจุดอ้างอิงหลัก
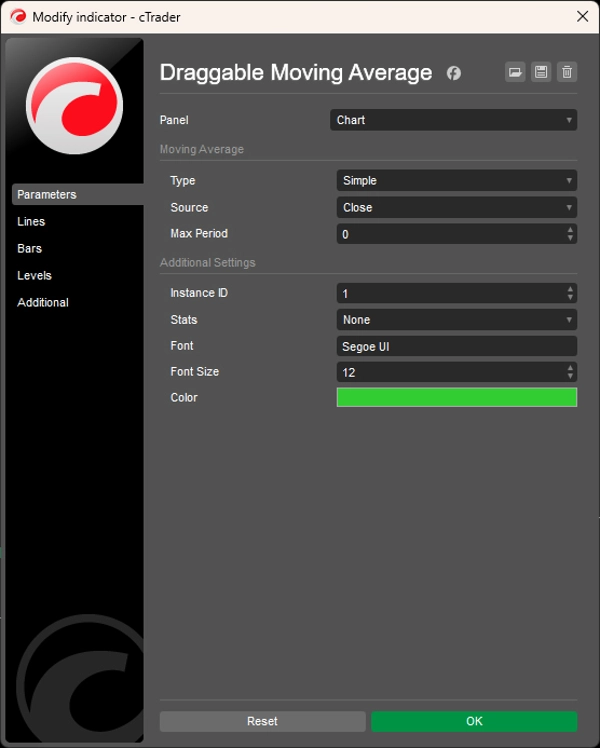
ช่วงเวลายังคงกำหนดพฤติกรรมการคำนวณ ในขณะที่พารามิเตอร์ Max Period จำกัดหน้าต่างการคำนวณแบบเลื่อนขณะที่พัฒนาไปข้างหน้าจากจุดยึด
แต่จุดยึดกำหนด จุดเริ่มต้นของการวัด.
นี่เปลี่ยนคำถามจาก:
"ฉันควรใช้ช่วงเวลา MA ไหน?"
เป็น:
"เหตุการณ์ราคาใดที่ฉันต้องการให้ MA นี้วัดจาก?"
สิ่งที่มันทำ
ค่าเฉลี่ยเคลื่อนที่แบบลากจุดยึดให้คุณกำหนดจุดเริ่มต้นนั้นเอง
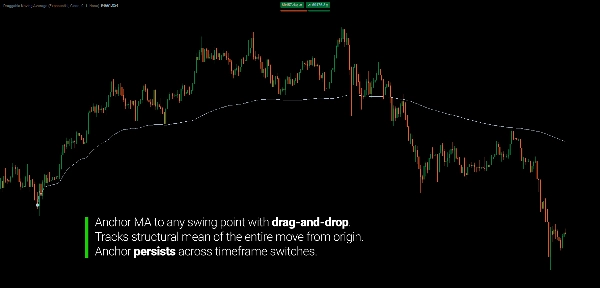
วางจุดยึดบนแท่งใดก็ได้ในประวัติราคา และค่าเฉลี่ยเคลื่อนที่จะเริ่มคำนวณจากจุดนั้นไปข้างหน้า
ลากจุดยึดไปยังแท่งอื่น และ MA จะคำนวณใหม่ทันที
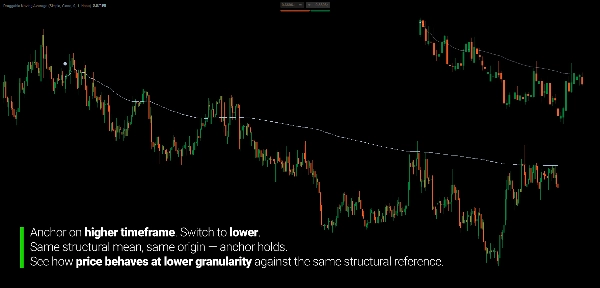
เปลี่ยนกรอบเวลา และจุดยึดยังคงติดกับจุดอ้างอิงประวัติศาสตร์เดียวกันในขณะที่การคำนวณปรับตามข้อมูลที่มีในแผนภูมิใหม่
จุดอ้างอิงชัดเจน — ไม่ซ่อนอยู่ภายในช่วงเวลา
วิธีการทำงาน
กระบวนการนี้ตั้งใจให้เรียบง่าย:
1. วางจุดยึด
เลือกแท่งใดก็ได้ที่สำคัญต่อการวิเคราะห์ของคุณ
2. MA เริ่มที่นั่น
การคำนวณเริ่มจากจุดเริ่มต้นที่คุณเลือกและพัฒนาไปข้างหน้า
3. ให้ราคาพัฒนา
เมื่อแท่งใหม่ปรากฏ ค่าเฉลี่ยจะรวมข้อมูลราคาที่พัฒนา
4. ย้ายจุดยึดเมื่อการอ้างอิงของคุณเปลี่ยน
ลากจุดยึดไปยังแท่งอื่นและการคำนวณทั้งหมดจะอัปเดตทันที
ไม่จำเป็นต้องเปลี่ยนช่วงเวลา MA เพื่อประมาณจุดเริ่มต้นที่แตกต่าง
เปลี่ยนจุดอ้างอิงเอง
ค่าเฉลี่ยเคลื่อนที่ที่สร้างขึ้นรอบการเคลื่อนไหว
เมื่อ MA ถูกยึดกับจุดเริ่มต้นของการเคลื่อนไหวราคาที่เฉพาะเจาะจง การคำนวณจะพัฒนาไปจากจุดเริ่มต้นนั้น
นั่นทำให้ MA มีบริบทที่แตกต่างจากค่าเฉลี่ยเลื่อนแบบทั่วไป
การเคลื่อนไหวแก้ไขสามารถมี MA ที่ยึดจุดของตัวเอง
แรงกระตุ้นสามารถมีอีกอันหนึ่ง
สวิงหลักสามารถมีอีกอันหนึ่ง
คุณไม่ต้องถาม MA เพื่ออธิบายจำนวนแท่งเทียนล่าสุดแบบสุ่มอีกต่อไป
คุณกำลังขอให้มันวัดส่วนเฉพาะของตลาด
ดูว่าราคาพัฒนาอย่างไรรอบค่าเฉลี่ย
MA ที่ยึดจุดสามารถใช้เป็นจุดอ้างอิงเพื่อสังเกตว่าราคามีพฤติกรรมอย่างไรในระหว่างการเคลื่อนไหว
ราคาอาจ:
- ขยายออกจากค่าเฉลี่ยในช่วงการเคลื่อนไหวที่แข็งแกร่ง
- กลับสู่ค่าเฉลี่ยในช่วงการรวมตัวหรือการแก้ไข
- ตัดผ่านค่าเฉลี่ยเมื่อลักษณะของการเคลื่อนไหวเปลี่ยนแปลง
- กลับมาที่ค่าเฉลี่ยหลังการเปลี่ยนทิศทาง
พฤติกรรมเหล่านี้ไม่ได้ถูกปฏิบัติเป็นสัญญาณซื้อขายอัตโนมัติ
จุดประสงค์ง่ายกว่า:
เพื่อทำให้ค่าเฉลี่ยของการเคลื่อนไหวราคาที่กำหนดมองเห็นได้
ความสำคัญมาจากการเคลื่อนไหวที่คุณเลือกวัด — ไม่ใช่จากตัวเลข MA ใดๆ
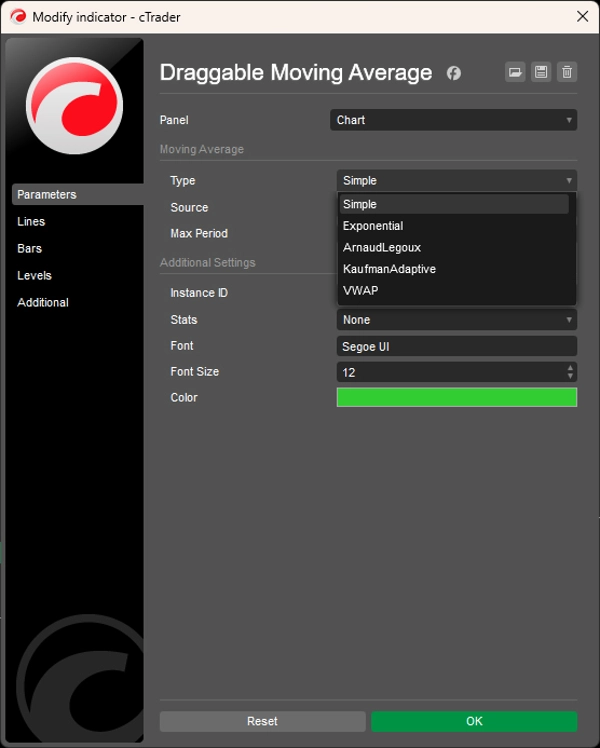
ห้าวิธีในการคำนวณค่าเฉลี่ย
เลือกการคำนวณที่เหมาะสมกับการวิเคราะห์ของคุณที่สุด:
แบบง่าย (SMA)
ค่าเฉลี่ยเลขคณิตตรงไปตรงมาที่พัฒนาไปจากจุดยึด
แบบเลขชี้กำลัง (EMA)
ให้น้ำหนักมากกว่ากับข้อมูลราคาล่าสุด
Arnaud Legoux (ALMA)
ค่าเฉลี่ยถ่วงน้ำหนักที่ออกแบบมาเพื่อลดความล่าช้าในขณะที่ยังคงความนุ่มนวล
Kaufman Adaptive (KAMA)
ปรับความนุ่มนวลตามประสิทธิภาพของตลาด
VWAP
วัดราคาถ่วงน้ำหนักด้วยปริมาณจากจุดเริ่มต้นที่เลือก
ประเภทการคำนวณทั้งหมดยังคงแนวคิดพื้นฐานเดียวกัน:
จุดยึดกำหนดจุดเริ่มต้นของการวัด
จุดอ้างอิงยังคงอยู่แม้เปลี่ยนกรอบเวลา
หนึ่งในคุณสมบัติที่มีประโยชน์ที่สุดของจุดยึดที่กำหนดไว้คือจุดอ้างอิงจะไม่หายไปเมื่อคุณเปลี่ยนกรอบเวลา
ยึดจุดเริ่มต้นของการเคลื่อนไหวบนแผนภูมิรายวัน
เปลี่ยนเป็น H1
แล้ว M15
จุดยึดยังคงผูกติดกับจุดประวัติศาสตร์เดียวกันในขณะที่ MA คำนวณใหม่โดยใช้ข้อมูลที่มีในกรอบเวลาใหม่
นี่ทำให้มันมีประโยชน์สำหรับการวิเคราะห์หลายกรอบเวลาที่ เหตุการณ์ราคาเดียวกัน ต้องคงเป็นจุดอ้างอิงในความละเอียดของแผนภูมิต่างๆ
สถิติทางเลือก
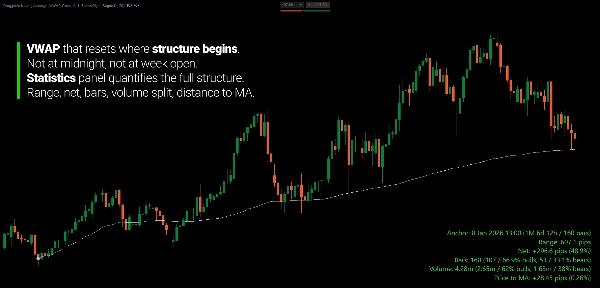
แผงสถิติทางเลือกให้มุมมองเชิงปริมาณของการเคลื่อนไหวราคาระหว่างจุดยึดและแท่งปัจจุบัน
มันสามารถแสดง:
- ช่วงในหน่วย pip
- การเปลี่ยนแปลงสุทธิในหน่วย pip และเปอร์เซ็นต์
- จำนวนแท่งกระทิง / แท่งหมีและเปอร์เซ็นต์
- ปริมาณกระทิง / หมีและเปอร์เซ็นต์
- ระยะห่างราคาจาก MA ในหน่วย pip และเปอร์เซ็นต์
- ระยะเวลา
- จำนวนแท่งตั้งแต่จุดยึด
แผงนี้เป็นทางเลือก
เครื่องมือหลักยังคงเป็นค่าเฉลี่ยเคลื่อนที่ที่ยึดจุด
หลายจุดอ้างอิง
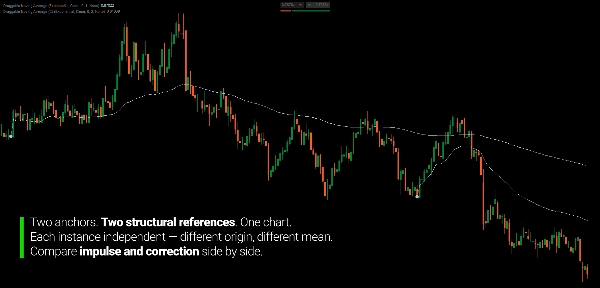
สามารถใช้หลายอินสแตนซ์พร้อมกันได้
MA หนึ่งตัวสามารถยึดกับจุดเริ่มต้นของการแก้ไข
อีกตัวสามารถยึดกับแรงกระตุ้นก่อนหน้า
แต่ละอินสแตนซ์มีตัวตนของตัวเอง ทำให้การเคลื่อนไหวราคาต่างๆ สามารถวัดได้อย่างอิสระบนแผนภูมิเดียวกัน
สร้างมาเพื่อการวัด ไม่ใช่การตามหาสัญญาณ
ค่าเฉลี่ยเคลื่อนที่แบบลากจุดยึดไม่ได้บอกคุณว่าจะซื้อหรือขายที่ไหน
มันให้สิ่งที่เป็นพื้นฐานมากกว่า:
วิธีการกำหนดอย่างชัดเจนว่าคุณต้องการให้ค่าเฉลี่ยเคลื่อนที่วัดส่วนใดของตลาด
ใช้มันเพื่อศึกษา:
- การเคลื่อนไหวแบบแรงกระตุ้นและการแก้ไข
- การพัฒนาสวิง
- พฤติกรรมราคารอบค่าเฉลี่ยที่กำหนด
- การกลับสู่ค่าเฉลี่ยภายในการเคลื่อนไหวเฉพาะ
- การเปลี่ยนแปลงลักษณะของการเคลื่อนไหว
- จุดอ้างอิงกรอบเวลาสูงจากแผนภูมิกรอบเวลาต่ำ
- การกระจายราคาที่แตกต่างจากจุดเริ่มต้นที่แตกต่างกัน
ตัวบ่งชี้ไม่ได้ตัดสินใจว่าจุดใดสำคัญ
คุณเลือกจุดอ้างอิง MA วัดสิ่งที่เกิดขึ้นจากจุดนั้น
คุณสมบัติหลัก
- จุดยึดลากได้อย่างเต็มที่
- จุดเริ่มต้นที่กำหนดโดยผู้ใช้
- MA คำนวณใหม่ทันทีเมื่อจุดยึดเคลื่อนที่
- จุดยึดยังคงอยู่ข้ามการเปลี่ยนกรอบเวลา
- ห้าวิธี MA: SMA, EMA, ALMA, KAMA, VWAP
- แหล่งราคาที่เลือกได้แปดแบบ
- Max Period จำกัดหน้าต่างเลื่อนจากจุดเริ่มต้นของจุดยึด
- แผงสถิติทางเลือกพร้อมตำแหน่งสี่มุม
- หลายอินสแตนซ์อิสระ
- ออกแบบมาสำหรับการวิเคราะห์หลายกรอบเวลา
---
การซื้อขายมีความเสี่ยง ตัวบ่งชี้นี้เป็นเครื่องมือวิเคราะห์ทางเทคนิคและควรใช้ร่วมกับการจัดการความเสี่ยงที่เหมาะสม
สรุป
This approach transforms the MA into a structural mean that reflects the average price evolution from a defined origin, aiding in mean reversion and reversal detection. Price behavior around this anchored MA provides insights into momentum, consolidation, and potential trend exhaustion.
The indicator supports five MA calculation methods—Simple (SMA), Exponential (EMA), Arnaud Legoux (ALMA), Kaufman Adaptive (KAMA), and Volume Weighted Average Price (VWAP)—with a configurable maximum period to cap the lookback window. It offers eight price source options and an optional statistics panel displaying real-time metrics such as range, net change, volume splits, and price distance from the MA.
Multiple instances can run simultaneously, each with a unique ID, allowing concurrent analysis of different structural moves without conflicts. This tool is designed for swing and position traders, multi-timeframe analysts, and discretionary traders who require precise, structure-based MA anchoring rather than arbitrary period-based averages.
รีวิวจากลูกค้า
การสนทนา
คำถามที่พบบ่อย






















ราคา