赫斯特周期通道振荡器高级版 — 指标说明
赫斯特周期通道振荡器高级版是基于赫斯特周期理论原理,为cTrader设计的专业多周期动量指标。它不是测量原始价格动量,而是将当前价格定位于动态计算的周期通道内,为交易者提供价格在其自然周期运动中所处位置的标准化视图。
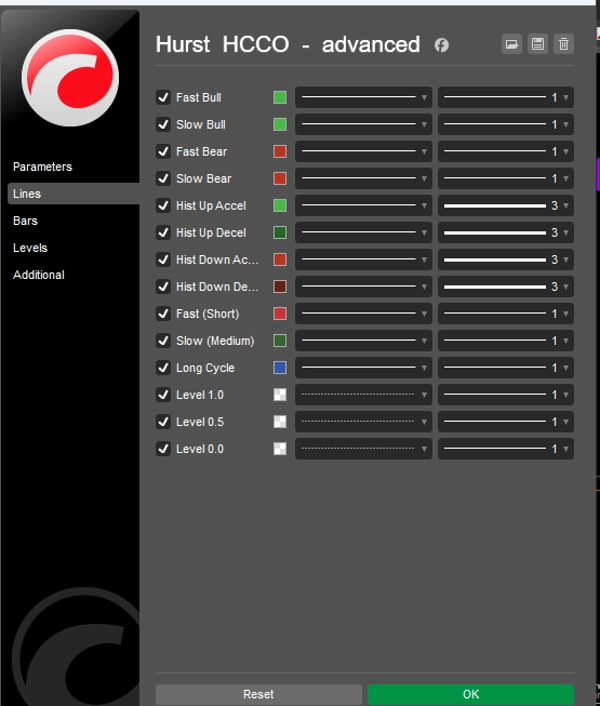
三层周期
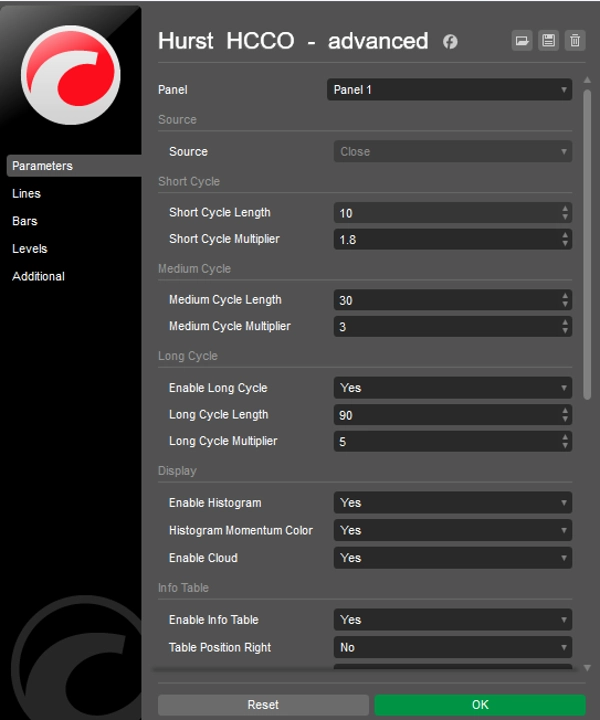
该指标计算三个独立的周期通道——短期、中期和长期——每个通道均由基于ATR包络的指数移动平均线构建并居中。短期和中期周期驱动主振荡器,而可选的长期周期提供更广泛的市场背景。所有周期长度及其ATR乘数均可完全配置。
快线和慢线振荡器
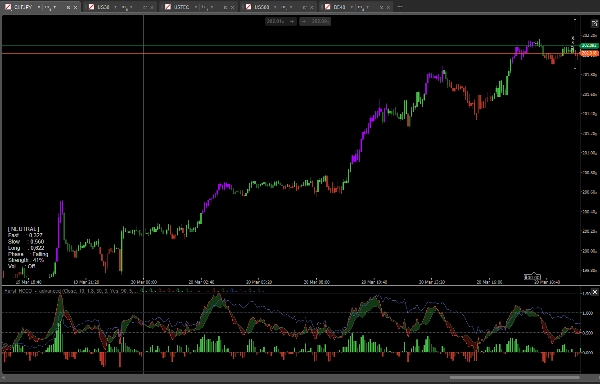
快线显示当前价格在中期周期通道中的位置——数值高于0.5表示价格处于周期的上半部分,低于0.5表示处于下半部分。慢线表示相对于中期周期的短期周期通道中点,作为更平滑的参考。两者共同构成一个类似MACD结构但基于周期几何的双线振荡器。
周期云
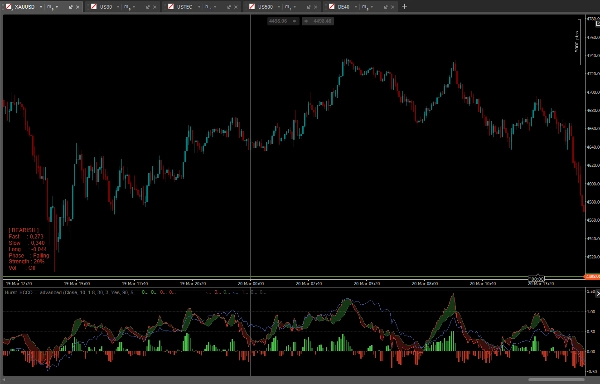
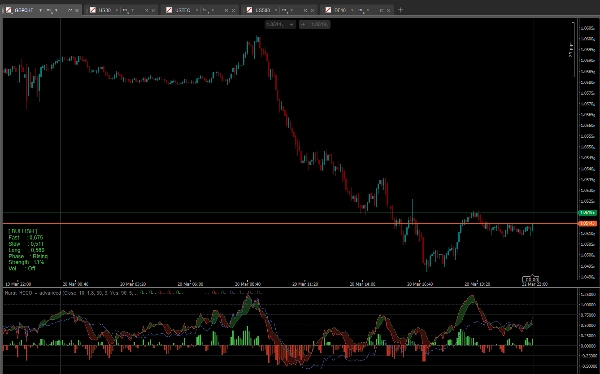
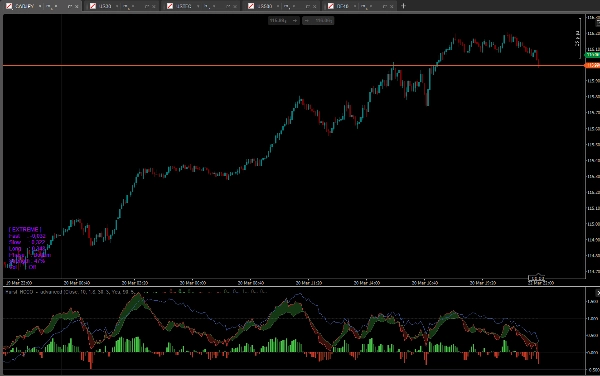
一个可选的云层填充快线和慢线之间的区域。当快线高于慢线时形成绿色云(看涨周期偏向),当快线低于慢线时形成红色云(看跌周期偏向)。云层使两个周期层之间的关系一目了然。
动量直方图
直方图绘制快线与慢线之间的差值,采用四色动量编码——看涨加速、看涨减速、看跌加速、看跌减速。这不仅便于观察方向,还能判断周期走势是增强还是减弱能量。
周期阶段检测
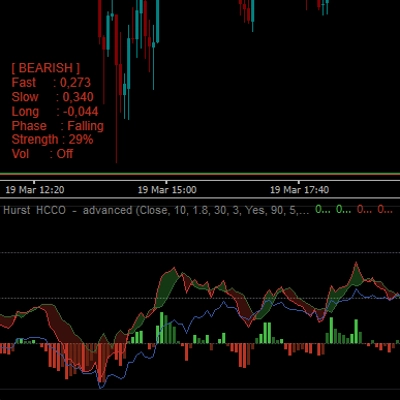
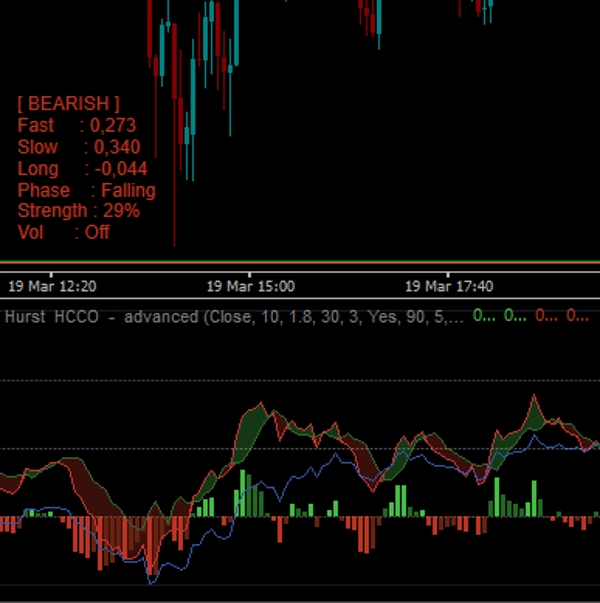
信息表显示当前周期阶段:底部、预底部、恢复、上升、减弱、峰后、峰顶。此标签直接来源于快线振荡器的数值及其方向,为交易者提供市场周期位置的通俗解读。
趋势强度
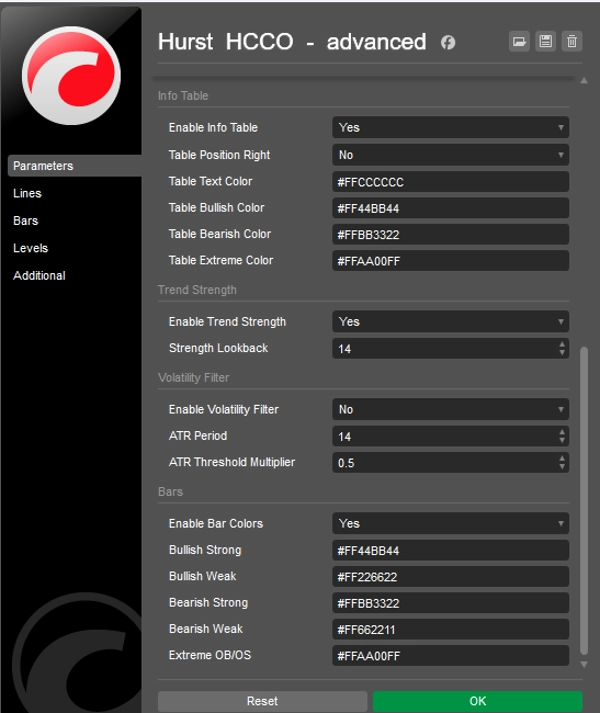
可配置的回溯期计算基于快线偏离0.5中点的程度的标准化趋势强度得分。结果以百分比形式显示在信息表中。
波动率过滤器
一个可选的基于ATR的波动率过滤器在市场波动率低于可配置阈值时,将直方图柱和柱颜色变灰,防止振荡器在盘整或震荡行情中发出误导信号。
信息表
一个紧凑的图表内表格显示当前市场状态(看涨、看跌、中性、极端)、快线、慢线和长线振荡器数值、周期阶段、趋势强度百分比及波动率过滤器状态。位置和所有颜色均可配置。
柱状颜色
启用时,图表蜡烛根据振荡器状态着色——强看涨、弱看涨、弱看跌、强看跌及极端超买/超卖。当快线超出0.0–1.0范围时出现极端读数,表示价格突破周期通道。
主要功能总结
- 基于赫斯特周期理论的三层可配置周期
- 归一化至周期通道位置的双快/慢振荡器
- 快线与慢线之间的周期云
- 四色动量直方图
- 带通俗标签的自动周期阶段检测
- 实时趋势强度百分比
- 基于ATR的波动率过滤器
- 带完整市场状态细分的图表内信息表
- 可选蜡烛颜色
- 所有颜色均支持Alpha通道,完全可定制
- 无重绘
5 | 100 % | |
4 | 0 % | |
3 | 0 % | |
2 | 0 % | |
1 | 0 % |