Penerangan
Kebanyakan penunjuk tren menjawab soalan yang sama dengan cara yang sama: melicinkan harga, melukis beberapa garis, mencari persilangan. Saluran Harga FDQ dibina berdasarkan soalan yang berbeza — apa sebenarnya yang dilakukan oleh harga, tanpa gangguan dan pergeseran, dan apa yang ia beritahu anda tentang ke mana ia mungkin pergi?
Hasilnya adalah penunjuk tren berasaskan saluran yang menggabungkan tiga lapisan analisis yang berbeza menjadi satu lapisan yang boleh dibaca.
- Perkara Utama
Titik Permulaan Berbeza. Siri harga yang digunakan oleh kebanyakan penunjuk adalah, secara statistik, satu masalah.
Harga mentah membawa komponen berjalan rawak yang mengaburkan struktur bermakna. Sebelum mana-mana saluran dilukis, FDQ menggunakan transformasi pembezaan pecahan — teknik yang dipinjam dari penyelidikan kuantitatif — yang menghapuskan pergeseran ini sambil sengaja mengekalkan ingatan jangka panjang dalam data. Apa yang tinggal adalah siri yang telah diubah yang masih mencerminkan di mana pasaran pernah berada, tetapi tidak lagi didominasi oleh di mana ia berada sekarang. Ini adalah asas yang dibina segala-galanya yang lain.
- Gangguan Ada Kos
Setiap kaedah pelicinan berasaskan kelewatan menukar masa untuk ketepatan. Penapisan Kalman tidak.
Penapis Kalman adalah proses anggaran berulang: ia sentiasa mengemas kini pandangannya tentang pasaran, mengimbangi berapa banyak untuk mempercayai data baru berbanding apa yang telah ditetapkan. Berbeza dengan purata bergerak, ia tidak mempunyai tetingkap pandangan tetap dan tidak melayan semua bar lalu sama rata. Outputnya adalah representasi harga yang lebih bersih yang bertindak balas dengan cepat terhadap pergerakan sebenar dan menahan reaksi terhadap gangguan — tanpa isyarat tertunda yang biasanya dihasilkan oleh pelicinan.
- Jalur Dibina dari Tingkah Laku, Bukan Formula
Jalur sisihan piawai menganggap harga diedarkan secara normal. Ia jarang berlaku.
Had saluran FDQ ditakrifkan menggunakan analisis kuantil — taburan statistik sebenar harga yang telah diubah sepanjang tempoh pandangan. Jalur atas menandakan tahap yang siri benar-benar capai pada ekstrem atas julatnya; jalur bawah melakukan perkara yang sama pada ekstrem bawah. Ini bukan sempadan teori yang dikira dari purata — ia mencerminkan di mana harga sebenarnya telah diniagakan, yang menjadikannya lebih responsif kepada bagaimana pasaran benar-benar berkelakuan pada bila-bila masa.
- Lapisan Kedua Dalam Saluran
Jalur luar menentukan julat. Jalur dalam menentukan zon.
Satu set jalur kedua terletak secara berkadar antara saluran luar dan garis tengahnya. Lapisan dalam ini mencipta zon dagangan yang berbeza — lebih sempit daripada saluran penuh, berasaskan asas statistik yang sama — yang berfungsi sebagai rujukan bertahap untuk kemasukan dan klasifikasi isyarat.
- Keadaan Tren Sebelum Segala-galanya
Isyarat tanpa konteks hanyalah data rawak.
Penunjuk menjejaki keadaan arah saluran secara berterusan, menggunakan mekanisme undian majoriti merentasi tiga komponen jalur. Apabila sekurang-kurangnya dua daripada tiga bergerak ke arah yang sama, keadaan tren disahkan sebagai Meningkat atau Menurun. Isyarat hanya dijana selaras dengan keadaan semasa — persediaan panjang hanya dalam keadaan Meningkat, persediaan pendek hanya dalam keadaan Menurun. Apabila pasaran tidak memenuhi ambang ini, tiada keadaan diisytiharkan dan tiada isyarat dijana. Peralihan antara keadaan ditandakan sebagai garis menegak terus pada carta.
- Tiga Persediaan Pantulan Berbeza
Tidak semua penarikan balik adalah sama. Penunjuk mengenal pasti tiga peringkat.
Setelah keadaan tren aktif, penunjuk memerhati corak pantulan tertentu — saat di mana harga bergerak bertentangan dengan tren, menyentuh tahap yang ditakrifkan, dan berbalik kembali melaluinya.
-
- Pantulan Tengah — Harga jatuh di bawah (atau naik di atas) garis tengah saluran dan pulih. Penarikan balik standard dalam tren.
- Pantulan Dalam — Harga melanjutkan lebih jauh, mencapai ekstrem jalur dalam sebelum pulih. Penarikan balik yang lebih komited dengan pembalikan yang lebih tegas.
- Pantulan Ringan — Harga menyentuh jalur dalam di sisi tren dan pantas kembali. Yang paling cetek daripada tiga, berlaku paling kerap.
Setiap jenis adalah berbeza secara visual pada carta dan boleh diaktifkan atau dinyahaktifkan secara berasingan.
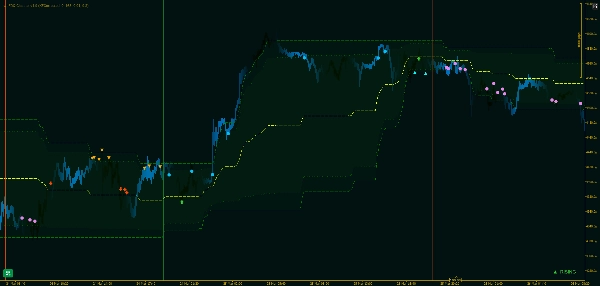
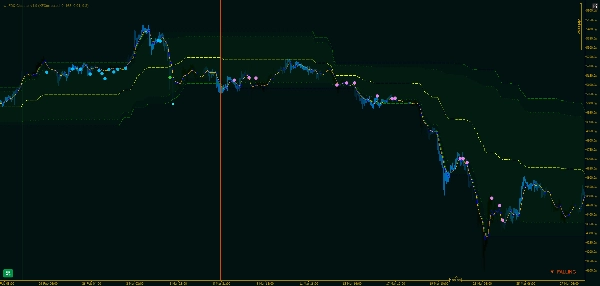
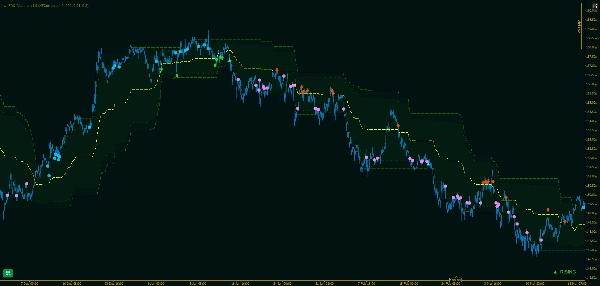
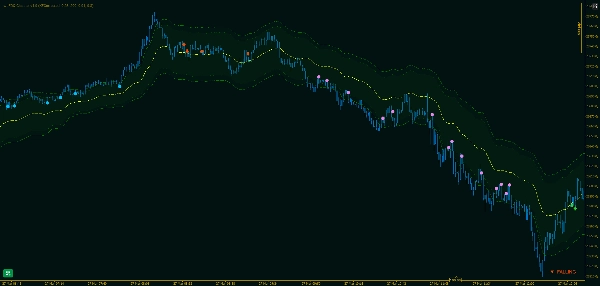
- Apa Yang Anda Lihat
Carta menceritakan kisah secara langsung, tanpa tafsiran.
Saluran utama, jalur dalam, dan garis tengah melapisi harga sebagai garis berterusan. Peralihan rejim ditandakan dengan garis menegak — hijau untuk Meningkat, merah untuk Menurun — jadi sejarah perubahan keadaan tren dapat dilihat dengan sekilas pandang. Penanda isyarat muncul pada bar di mana setiap pantulan disahkan, dengan ikon berasingan untuk setiap jenis isyarat dan arah.
- Mengapa Pendekatan Ini Kukuh
Kebanyakan penunjuk saluran tertinggal apabila pasaran bergerak pantas dan terlebih reaksi apabila tidak.
Kerana saluran FDQ dibina berdasarkan transformasi pegun yang mengekalkan ingatan dan bukannya purata bergulir, jalur menyesuaikan dengan taburan tingkah laku sebenar dan bukannya mengejar harga. Lapisan Kalman mengekalkan anggaran asas bersih tanpa memperkenalkan kos masa yang datang dengan pelicinan tetingkap. Hasilnya adalah saluran yang kekal bermakna merentasi pelbagai keadaan pasaran — tren, julat, dan peralihan — tanpa memerlukan pelarasan manual.
Ringkasan
The channel boundaries are defined by quantile analysis of the transformed price distribution rather than standard deviation, capturing actual price extremes over the lookback period. It features outer bands marking the full range and inner bands creating a narrower trading zone for refined entry signals. The indicator continuously tracks trend direction using a majority vote across three band components, confirming Rising or Falling states and marking transitions with vertical lines on the chart.
Within active trends, wt.FDQ Channel identifies three distinct rebound setups—Light, Mid, and Deep—each representing different pullback intensities and reversal confirmations. These signals are visually distinct and configurable. The overlay displays the primary channel, inner bands, midline, trend states, and rebound signals directly on the price chart, supporting analysis across various markets including Forex, indices, and cryptocurrencies.
Ulasan pelanggan
5 | 100 % | |
4 | 0 % | |
3 | 0 % | |
2 | 0 % | |
1 | 0 % |


