present
가입하고 첫 구매 시 $50 할인을 받으세요
Trading product for HTF Mumlar 지표 EMA Key Levels, image 1
HTF Mumlar
지표
버전 1.0, Jul 2026
Windows, Mac
Trading product for HTF Mumlar 지표 EMA Key Levels, image 2
Trading product for HTF Mumlar 지표 EMA Key Levels, image 3
가입일 07/07/2026

설명

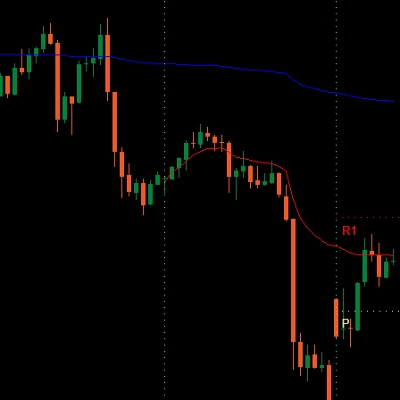
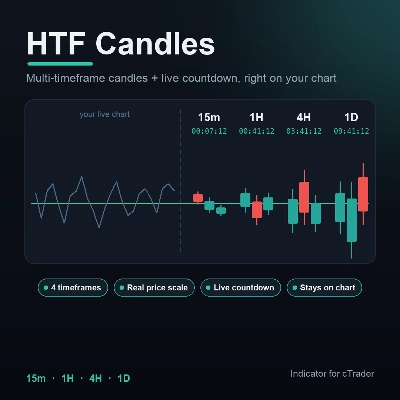
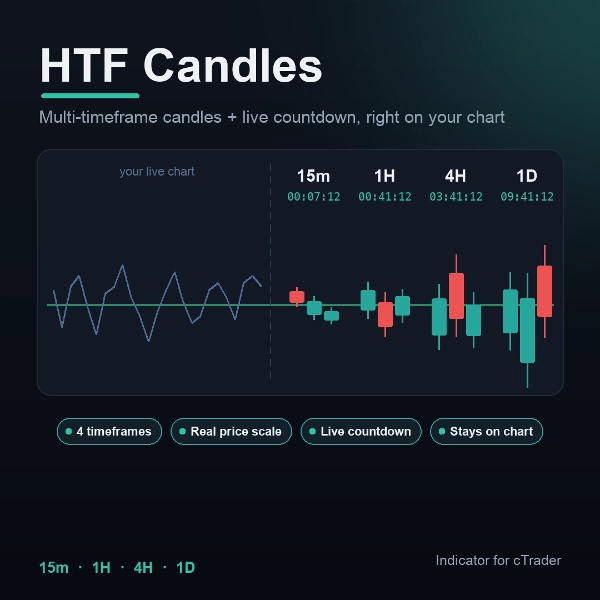
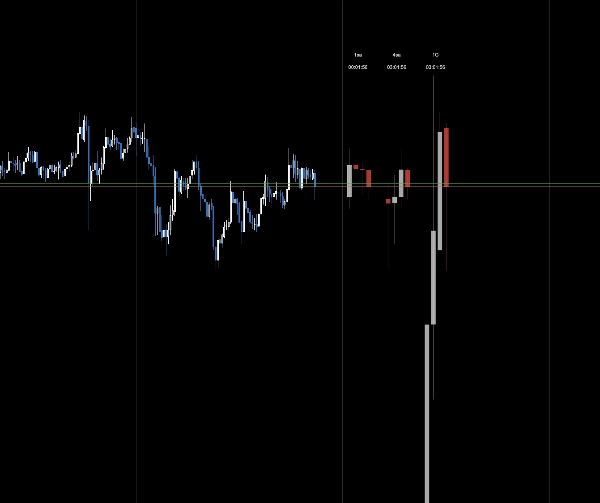
HTF Candles projects the most recent candles of several timeframes directly onto your current chart — all drawn to the same real price scale — so you can read multi-timeframe structure without ever switching charts.

What it shows To the right of live price, HTF Candles plots the last few real candles of each selected timeframe (default 15m, 1H, 4H, 1D). Every candle sits on the chart's actual price axis, so sizes are true to life — a daily candle towers over a 15-minute one, exactly as the market sees it. The right-most candle in each group is the live, still-forming candle and updates tick by tick.

How to read it

  • Each column is one timeframe, labeled at the top (15m · 1H · 4H · 1D).
  • Directly under each label is a live countdown to that timeframe's next candle close.
  • Green/red bodies show bullish/bearish at a glance, so you can confirm higher-timeframe momentum while trading a lower one.

Key settings

  • Up to 5 timeframe slots — enable/disable each and choose any timeframe.
  • Number of candles per timeframe (default 4).
  • Body up/down colors, candle width, spacing, and padding from price.
  • Independent toggles for the timeframe label and the countdown, plus font size and color.

Typical use

  • Confirm trend alignment across timeframes before entering a trade.
  • Time entries and exits around higher-timeframe closes using the countdowns.
  • Keep full multi-timeframe context on a single screen — ideal for scalpers and day traders who don't want to flip charts.

Best suited for Intraday and swing traders in any market (forex, indices, crypto, metals) who rely on multi-timeframe analysis and want higher-timeframe context and candle-close timing without leaving their working chart.

요약

지표 프로필
지표 카테고리
추세
출력 유형
시각화
데이터 요구 사항
막대만

상담

고객 리뷰

0.0
리뷰: 0
고객 리뷰
이 상품에 대한 리뷰가 아직 없습니다. 이미 사용해 보셨나요? 다른 사람들에게 가장 먼저 소개해 주세요!

자주 묻는 질문(FAQ)

EMA
Key Levels
BOS
Liquidity Sweep
Order Block
Market Structure
MACD
트레이딩 봇, 지표, 플러그인 등 cTrader Store에서 제공되는 상품은 제3자 개발자에 의해 제공되며, 이는 단순히 정보 및 기술적 접근을 목적으로 제공된 것입니다. cTrader Store는 중개인이 아니며, 투자 조언, 개인별 추천 또는 향후 성과에 대한 어떠한 보장도 제공하지 않습니다.

좋아하실 만한 다른 항목

지표
AI
Prop
+9
A cutting‑edge trading indicator that fuses AI and mathematics with adaptive logic to classify market regimes.
지표
MACD
Forex
+1
😎Read the description before purchasing💩
지표
Signal
Breakout
+1
Bolliger Bands + Hamster-Coder™ Timeframe Decoupling
지표
AI
ATR
+26
Exploit market imbalances with auto FVG zones—fade, extend, and filter with precision.
지표
Forex
BTCUSD
+4
🚀 HALF TREND Indicator - The Ultimate Trend Following System 🚀
지표
Signal
Trades Opening Range Breakouts Indicator with dynamic stops/targets adapting to market volatility.
지표
Drawdown Monitor
Protect your funded account. Real-time Daily Equity Drawdown monitor with Green / Orange / Red flashing alerts.
지표
Auto Fibonacci Retracement Indicator for cTrader
지표
SMC
NAS100
+5
Rolling Volume Profile MTF with 24H, 7D, 30D profiles and a precise NY Open marker.
지표
Forex
Signal
+4
Gann Pivot Vision is an innovative analytical tool that combines classic pivot reversal levels and Gann geometry
지표
ADX
ATR
+2
GOLD SENTINEL v1.0 - A CANDLE-COLORING INDICATOR FOR GOLD.
지표
Prop
VWAP
+5
Multi-anchor VWAP indicator for cTrader. Plots two VWAP lines (red and blue) with selectable anchors.
지표
Prop
Forex
+11
🌊 See when the market is truly in play. Tsunami measures Relative Volume by time-of-day 🌊
지표
ATR
MSS
+5
Advanced market structure and institutional cycle mapper with visual reference cards and entry alerts
지표
ATR
Wedge
+2
Strong Supertrend Turn Market Movement into a Clear Map Market analysis
지표
Forex
BTCUSD
+12
🎯Automatically identifies the market's significant turning points (key H & L) and draws dynamic support and.....✍️
"SCOB" 로고
최고 평점
4.4
(5)
$19
/
$20
지표
SMC
Prop
+12
SCOB - Single Candle Order Block Indicator
지표
ATR
Channel
Reversal Trap Probability Bands plots a dynamic volatility envelope around price & automatically detects "trap" reversal

가격

가입일 07/07/2026