MARCs_MARKET_OVERVIEW_LITE_XAUUSD
อินดิเคเตอร์
1 ดาวน์โหลด
เวอร์ชัน 1.0, Aug 2026
Windows, Mac
Trading product for MARCs_MARKET_OVERVIEW_LITE_XAUUSD อินดิเคเตอร์ Key Levels RSI, image 2
Trading product for MARCs_MARKET_OVERVIEW_LITE_XAUUSD อินดิเคเตอร์ Key Levels RSI, image 3
Trading product for MARCs_MARKET_OVERVIEW_LITE_XAUUSD อินดิเคเตอร์ Key Levels RSI, image 4
Trading product for MARCs_MARKET_OVERVIEW_LITE_XAUUSD อินดิเคเตอร์ Key Levels RSI, image 5
ตั้งแต่ 24/06/2026
1
ติดตั้งฟรี

คำอธิบาย

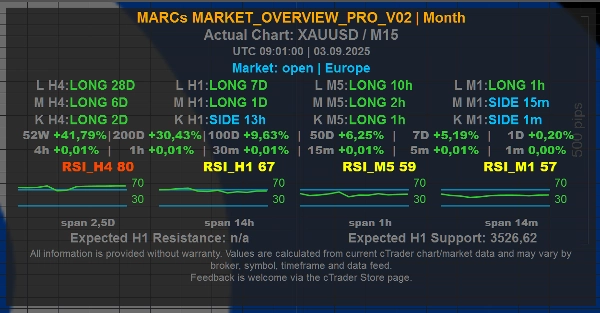
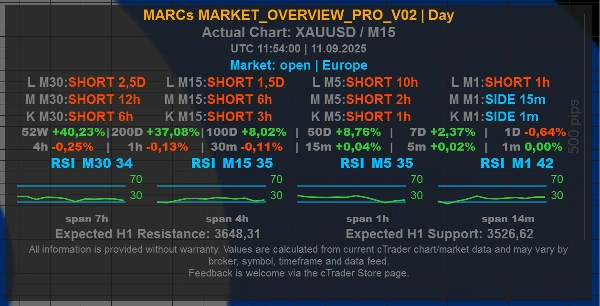
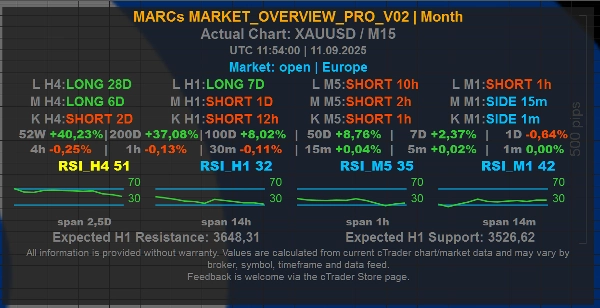
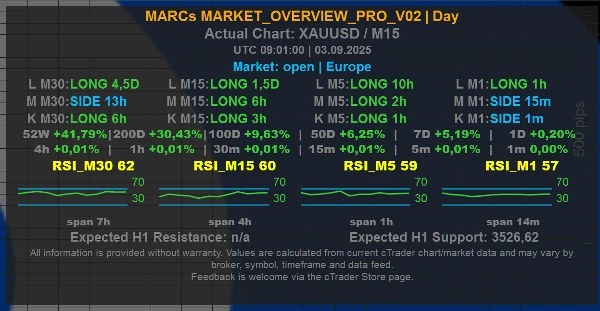
MARCs Market Overview Lite XAUUSD is a free, reduced-scope market overview indicator for cTrader.


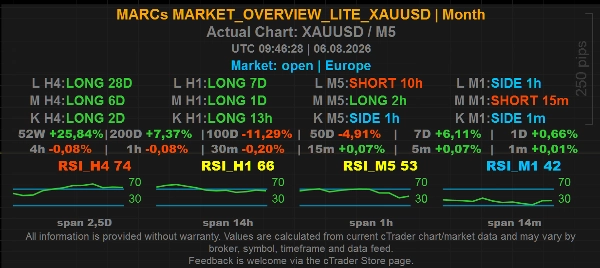
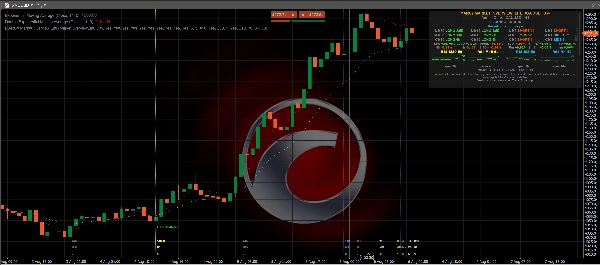
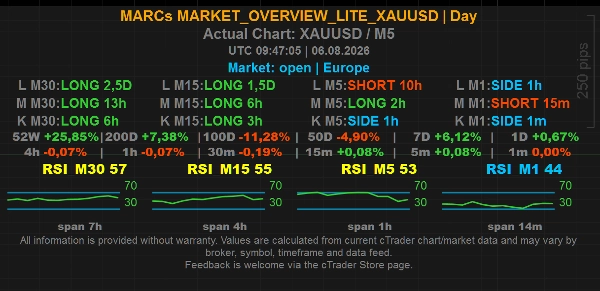
It displays a compact on-chart dashboard for XAUUSD / Gold charts with multi-timeframe trend context, RSI readings, market/session information, optional chart-level values and a simplified set of display controls.


This Lite edition is designed as a focused XAUUSD overview tool. It keeps the core panel workflow of MARCs Market Overview while using fixed internal settings and a limited preset selection.


Main features:

- Free Lite edition for XAUUSD charts

- Compact on-chart market overview panel

- Multi-timeframe trend rows for short, medium and long market context

- RSI values and mini RSI history across fixed internal timeframes

- Market/session line with UTC time

- Day and Month time-horizon presets

- Optional market line

- Optional H1 chart-level values shown directly in the panel

- Optional simplified H1 level lines on the chart

- Optional line labels, level origin markers and lookback markers

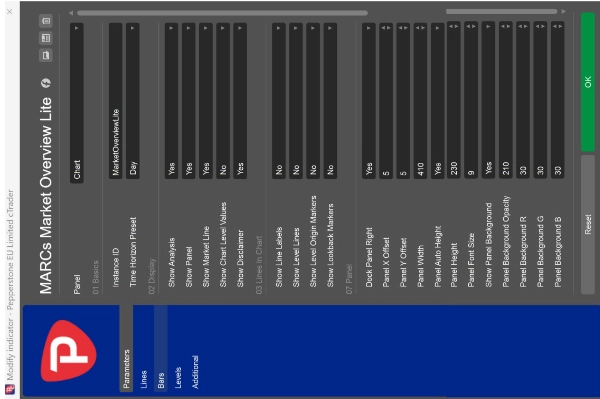
- Fully adjustable panel position, width, height, font size and background appearance


Lite edition limitations:

- Works on XAUUSD charts only

- Time Horizon Preset is limited to Day and Month

- Trend rows use fixed internal timeframe and candle settings

- RSI display uses fixed internal settings

- Time display uses fixed internal settings

- Chart level values are limited to H1

- Chart level lines are available as a simplified on/off option and use fixed H1 levels

- Some advanced customisation options from the Pro version are not included


If the indicator is attached to another symbol, the panel shows a clear XAUUSD-only notice instead of displaying overview values.


Level Lines and Chart Level Values:

The optional Show Level Lines setting can display calculated H1 chart reference levels. In the Lite edition, this is simplified to an on/off option. When enabled, the indicator shows the nearest calculated resistance above the current price and the nearest calculated support below the current price.


The optional Show Chart Level Values setting can show the same nearest H1 resistance/support reference values directly in the panel without drawing lines on the chart. The panel line is labelled, for example, "Chart Levels H1 | R ... | S ..." to make clear that the values refer to chart-level references.


How Level Lines are calculated:

The levels are derived from past swing highs and swing lows in the selected internal timeframe. Nearby swing points are grouped into level clusters, and only areas with enough repeated touches are shown. This makes the lines visual market-context markers based on available chart history.


What Level Lines do not mean:

Level Lines are not buy signals, sell signals, stop-loss recommendations, take-profit recommendations or investment advice. They do not predict that price will reverse, break out or react at a specific level.


About the Pro version:

MARCs Market Overview Pro offers broader symbol use, more time-horizon presets and more detailed customisation options. The Lite XAUUSD edition is a free, focused version for traders who want a simpler Gold/XAUUSD market overview panel.


Important:

MARCs Market Overview Lite XAUUSD is an analysis-only market overview tool. It does not place trades, manage positions, provide investment advice or guarantee trading results.


All readings depend on the available cTrader chart data, broker symbol feed, timeframe and market history. Values may differ between brokers, symbols and data feeds.


Trading involves risk. Past performance does not guarantee future results.


สรุป

สรุปโดย AI
MARCs Market Overview Lite XAUUSD is a market overview indicator designed for cTrader, focused exclusively on XAUUSD (Gold) charts. It provides a compact on-chart dashboard displaying multi-timeframe trend context (short, medium, long), RSI values with mini history, and market/session information with UTC time. The indicator includes fixed Day and Month time-horizon presets and offers optional features such as market lines, H1 chart-level values, simplified H1 level lines, line labels, and level origin markers.
Level lines are calculated from past swing highs and lows on the H1 timeframe, highlighting key resistance and support clusters based on repeated price touches. These lines serve as visual market context markers but do not constitute trading signals or advice.
The panel’s position, size, font, and background appearance are fully adjustable. The Lite edition uses fixed internal settings and limited presets, restricting its use to XAUUSD charts only. It does not place trades or provide investment recommendations. This tool relies on available chart data and broker feeds, which may vary.
This edition offers a streamlined overview for Gold traders, with broader symbol support and customization available in the Pro version.
โปรไฟล์อินดิเคเตอร์
หมวดหมู่อินดิเคเตอร์
โครงสร้างตลาด (SMC)
ประเภทเอาต์พุต
การแสดงเป็นภาพ
ตัวกรอง
ข้อกำหนดด้านข้อมูล
แท่งเท่านั้น
สัญญาณที่รองรับ
ความแข็งแกร่งของแนวโน้ม
แตะ Level ที่ระบุ

รีวิวจากลูกค้า

0.0
รีวิว: 0
รีวิวจากลูกค้า
ยังไม่มีรีวิวสำหรับผลิตภัณฑ์นี้ หากเคยลองแล้ว ขอเชิญมาเป็นคนแรกที่บอกคนอื่น!

การสนทนา

คำถามที่พบบ่อย

Key Levels
RSI
Market Structure
Risk Dashboard
Support & Resistance
ผลิตภัณฑ์ที่มีให้บริการผ่าน cTrader Store รวมถึงบอทการเทรด อินดิเคเตอร์ และปลั๊กอิน มีให้บริการโดยนักพัฒนาบุคคลที่สามและมีไว้เพื่อวัตถุประสงค์ในการเข้าถึงข้อมูลและทางเทคนิคเท่านั้น cTrader Store ไม่ใช่โบรกเกอร์และไม่ได้ให้คำแนะนำการลงทุน คำแนะนำส่วนบุคคล หรือการรับประกันผลการดำเนินงานในอนาคต

เพิ่มเติมจากผู้เขียนคนนี้

cBot
Conservative
Fixed Risk %
+5
MARCs GOLD H4-Gold-Swing-Bot for XAUUSD with transparent long-term backtests and optional reserve/guard system.
3.01
อัตราส่วน กำไรต่อขาดทุน
อินดิเคเตอร์
RSI
Key Levels
+3
MARCs Multi-timeframe market dashboard with trend rows, RSI context, sessions, presets and optional chart levels.

นอกจากนี้คุณยังอาจชอบ

อินดิเคเตอร์
Prop
Forex
+2
⚔️ JPY Samurai Breakout Pro — Professional Breakout Indicator for cTrader ⚔️
"LevelMaster SR" โลโก้
ยอดนิยม
4.5
(2)
$19
/
$30
อินดิเคเตอร์
ATR
Forex
+3
LevelMaster S/R: Pinpoint key support & resistance zones with precision. Perfect for traders of all levels Trade smarter
อินดิเคเตอร์
Key Levels
Order Block
+2
It monitors trend lines on price charts and fires multi-channel alerts and optionally places trades when price crosses..
อินดิเคเตอร์
Prop
Forex
+14
🚀See the market’s framework, decide faster. Session-Aware Pivots. Auto Presets. Pro-Grade Zones.🚀
อินดิเคเตอร์
RSI
Breakout
+1
Dynamically adjusts regression channels based on ZigZag extremes, resetting when price breaks bands to track real trends
อินดิเคเตอร์
RSI
MACD
+2
A straightforward yet effective tool signals entry points for both buying and selling. Include 3 Moving Average
อินดิเคเตอร์
BOS
CHOCH
+5
A professional-grade cTrader indicator for traders following the Inner Circle Trader (ICT) methodology. It replaces 6–8
"TradingViewMACD" โลโก้
ยอดนิยม
5.0
(1)
$19
/
$20
อินดิเคเตอร์
MACD
Signal
Enhance your trading strategy with our customizable TradingViewMACD indicator. Optimize and elevate your market analysis
อินดิเคเตอร์
EMA
MACD
+2
Combines MACD's Fast/Slow EMAs with a dynamic Volume Profile, coloring volume by direction and highlighting the POC.
อินดิเคเตอร์
Prop
Forex
+13
Supertrend - Multi-Timeframe Indicator
อินดิเคเตอร์
Prop
Forex
+11
⚡Nebula Range Filter is a professional trend filter indicator for cTrader⚡
อินดิเคเตอร์
Smart Signal Reversal Trend + Patterns
อินดิเคเตอร์
RSI
Signal
+2
Combines SMA with dynamic correlation to adapt to market trends. Adjusts sensitivity, filters noise🚀📉
อินดิเคเตอร์
ATR
Forex
+3
Lightweight adaptive filter with dynamic bands. Clean, noise-free trend structure.
อินดิเคเตอร์
BOS
EMA
+5
Directional volume heatmap: see if a price zone was built on buying or selling, not just how much.
อินดิเคเตอร์
SMC
Prop
+13
Institutional FVG detection with HTF projection, precise volume deltas, and smart fill logic.
อินดิเคเตอร์
Forex
BTCUSD
+4
The Linear Regression Oscillator (LRO) is a technical indicator based on linear regression analysis.
อินดิเคเตอร์
don't move to the end of chart after timeframe changing. it should be better to use for near history. for long history

ราคา

ตั้งแต่ 24/06/2026
1
ติดตั้งฟรี