
Beschreibung
Was ist LTtradingBox?
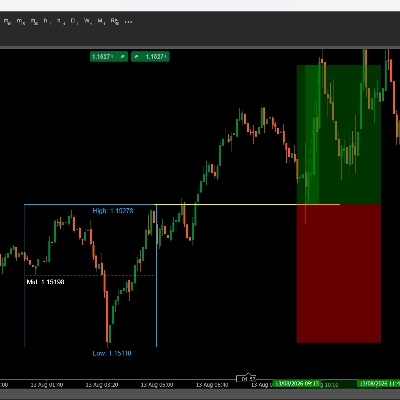
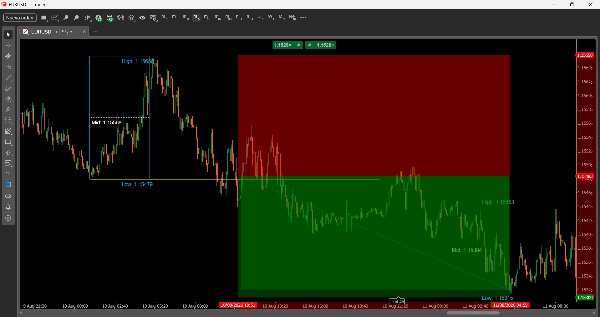
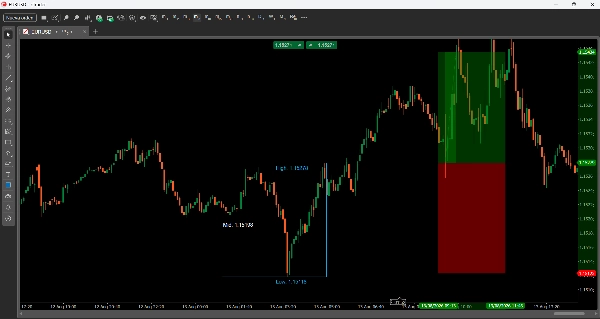
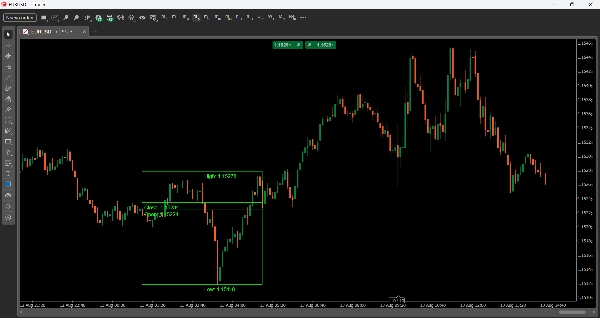
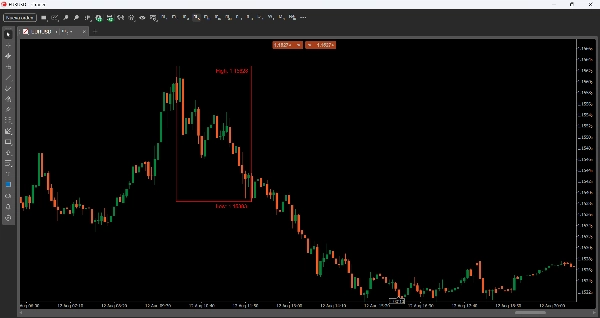
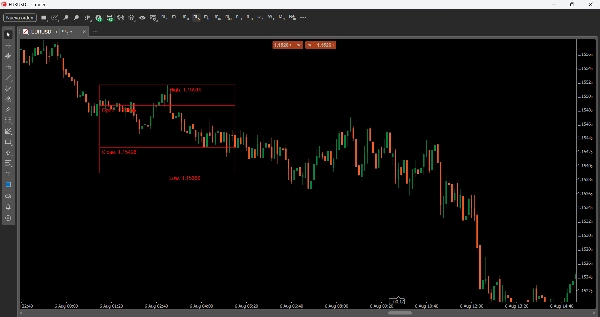
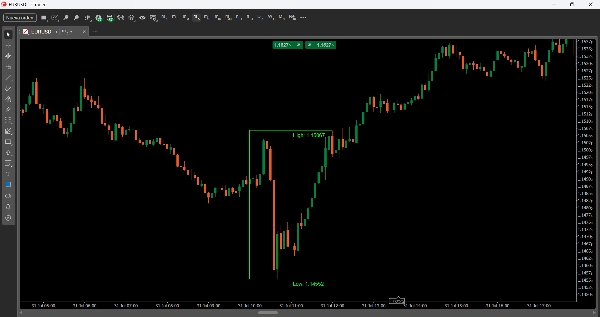
LTtradingBox markiert visuell den Preisbereich (hoch, niedrig, Eröffnung und Schluss) eines von Ihnen definierten Zeitfensters – zum Beispiel die Londoner oder New Yorker Sitzung. Die Box ändert automatisch die Farbe basierend auf dem Ergebnis dieser Sitzung: grün, wenn sie bullisch schloss, rot, wenn sie bärisch schloss, grau, wenn neutral (oder welche Farben Sie auch immer für jeden Fall wählen). Sie fügt auch Referenzlinien (Mittlerer Preis, Mittlere Zeit) und eine optionale visuelle Füllung hinzu, die Ihnen hilft, Liquiditätszonen, Akkumulationsbereiche und wichtige Handelsniveaus auf einen Blick zu erkennen.
Parameter
Zeiteinstellungen
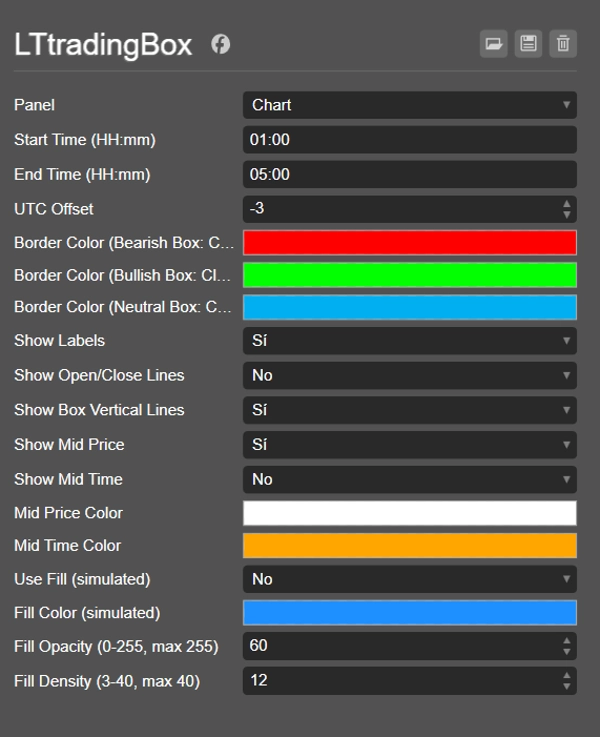
- Startzeit (HH:mm) — Startzeit der Box (24-Stunden-Format).
- Endzeit (HH:mm) — Endzeit der Box.
- UTC-Versatz — Zeitliche Anpassung, damit die Box mit Ihrer Ortszeit oder der Sitzung, die Sie verfolgen möchten (z. B. London, NY, Asien), übereinstimmt, unabhängig von der Zeitzone Ihres Brokers.
Farben
- Rahmenfarbe (bärische Box: Schluss < Eröffnung) — Rahmenfarbe, wenn die Box bärisch schließt.
- Rahmenfarbe (bullische Box: Schluss > Eröffnung) — Rahmenfarbe, wenn die Box bullisch schließt.
- Rahmenfarbe (neutrale Box: Schluss == Eröffnung) — Rahmenfarbe, wenn Schluss gleich Eröffnung ist.
Anzeigeoptionen
- Beschriftungen anzeigen — Schaltet die Textbeschriftungen für Hoch, Tief, Eröffnung und Schlusswerte ein oder aus.
- Linien für Eröffnung/Schluss anzeigen — Zeichnet horizontale Linien, die den Eröffnungs- und Schlusskurs innerhalb der Box markieren.
- Vertikale Linien der Box anzeigen — Aktiviert das vollständige Rechteck (4 Rahmen); wenn deaktiviert, werden nur die Hoch- und Tief-Linien angezeigt.
- Mittleren Preis anzeigen — Zeichnet eine gepunktete Linie auf der Mitte zwischen Hoch und Tief.
- Mittlere Zeit anzeigen — Zeichnet eine vertikale Linie auf der zeitlichen Mitte der Box.
- Farbe Mittlerer Preis / Farbe Mittlere Zeit — Anpassbare Farben für diese Linien.
Füllung (visuelle Füllung)
- Füllung verwenden (simuliert) — Aktiviert eine simulierte Füllung innerhalb der Box (mit überlagerten dünnen Linien).
- Füllfarbe (simuliert) — Füllfarbe.
- Füll-Deckkraft (0-255, max. 255) — Transparenzgrad der Füllung.
- Fülldichte (3-40, max. 40) — Anzahl der Linien, die zur Simulation der Füllung verwendet werden (höhere Dichte = solidere Füllung).
Handelsideen
- Ausbruch und Retest: Warten Sie, bis der Preis das Hoch oder Tief der Box durchbricht und dann zurückkehrt, um dieses Niveau als Unterstützung/Widerstand erneut zu testen, bevor Sie in Richtung des Ausbruchs einsteigen.
- Umkehr an Extremen: Wenn der Preis das Hoch oder Tief der Box berührt, ohne mit Stärke durchzubrechen, kann dies eine Ablehnung signalisieren und eine Bewegung zur gegenüberliegenden Seite der Box anzeigen.
- Richtungstendenz nach Sitzung: Die Farbe der Box gibt Ihnen eine schnelle Tendenz (bullisch/bärisch/neutral) darüber, wie sich diese Sitzung bewegt hat, nützlich zur Abstimmung von Einstiegen in späteren Sitzungen.
- Mittlerer Preis als Magnet: Der Mittelpunkt fungiert oft als Ausgleichszone – suchen Sie nach Einstiegen, wenn der Preis nach einer starken impulsiven Bewegung zum Mittelpunkt zurückkehrt.
- Vergleich aufeinanderfolgender Boxen: Da jede Tagesbox gespeichert wird (über ihr Datums-Tag), können Sie den Bereich und die Tendenz mehrerer aufeinanderfolgender Sitzungen vergleichen, um kurzfristige Trends zu erkennen.
Zusammenfassung
KI-Zusammenfassung
LTtradingBox is a customizable trading indicator that visually highlights the price range—high, low, open, and close—within any user-defined time window, such as a specific trading session. The indicator draws a colored box representing this range, automatically changing its border color to green for bullish closes, red for bearish closes, or gray for neutral, with customizable color options. It includes reference lines for the midpoint price and midpoint time, which can be displayed as dotted or vertical lines, aiding in identifying liquidity zones, accumulation areas, and key support/resistance levels.
Users can configure start and end times, apply a UTC offset to align with local or session times, and toggle display options such as labels for price points, open/close lines, full box borders, and visual fills with adjustable color, opacity, and density. The indicator supports trading strategies including breakout and retest of box boundaries, reversal signals at extremes, session-based directional bias, and using the midpoint as a rebalancing zone. It also allows comparison of consecutive session boxes to detect short-term trends. LTtradingBox is designed to assist traders in quickly identifying key levels and market structure within chosen timeframes.
Users can configure start and end times, apply a UTC offset to align with local or session times, and toggle display options such as labels for price points, open/close lines, full box borders, and visual fills with adjustable color, opacity, and density. The indicator supports trading strategies including breakout and retest of box boundaries, reversal signals at extremes, session-based directional bias, and using the midpoint as a rebalancing zone. It also allows comparison of consecutive session boxes to detect short-term trends. LTtradingBox is designed to assist traders in quickly identifying key levels and market structure within chosen timeframes.
Indikatorprofil
Indikatorkategorie
Unterstützung und Widerstand
Ausgabetyp
Visualisierung
Datenanforderungen
Nur Balken
Unterstützte Signale
Ausbruch
Wendepunkt
Level – Durchbrechen
Level – Berührung
Kundenbewertungen
0.0
Bewertungen: 0
Kundenbewertungen
Bisher gibt es keine Bewertungen für dieses Produkt. Haben Sie es schon ausprobiert? Dann können Sie die erste Person sein, die andere darüber informiert!
Diskussion
Häufig gestellte Fragen (FAQ)
Key Levels
Support & Resistance
Über den cTrader Store verfügbare Produkte, einschließlich Handelsbots, Indikatoren und Plugins, werden von externen Entwicklern bereitgestellt und nur zu Informations- und technischen Zugriffszwecken verfügbar gemacht. cTrader Store ist kein Broker und erbringt keine Anlageberatung, persönlichen Empfehlungen oder eine Garantie für zukünftige Performance.


















Preis
Seit 10/01/2025