present
Registrati e ricevi uno sconto da $50 sul tuo primo acquisto
Trading product for MACD Candles and Arrows - Muravha Indicatore MACD, image 1
MACD Candles and Arrows - Muravha
Indicatore
Versione 1.0, Aug 2026
Windows, Mac
4.5
Recensioni: 2
Trading product for MACD Candles and Arrows - Muravha Indicatore MACD, image 2
Trading product for MACD Candles and Arrows - Muravha Indicatore MACD, image 3
Trading product for MACD Candles and Arrows - Muravha Indicatore MACD, image 4
Trading product for MACD Candles and Arrows - Muravha Indicatore MACD, image 5
Trading product for MACD Candles and Arrows - Muravha Indicatore MACD, image 6
4.15M
Volume negoziato
39.99K
Profitto in pip
1
Vendite

Descrizione

Candele & Frecce MACD

Panoramica

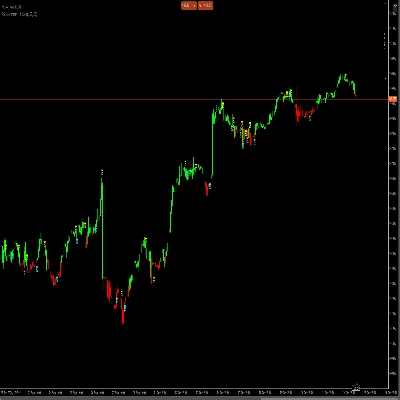
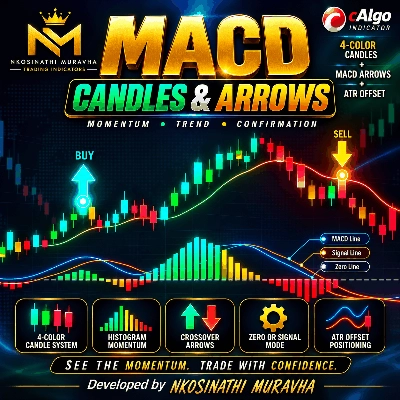
Candele & Frecce MACD è un indicatore di momentum e conferma del trend progettato per aiutare i trader a identificare rapidamente i cambiamenti nel momentum rialzista e ribassista direttamente sul grafico dei prezzi.

Combina l'analisi dell'istogramma MACD, i crossover della linea di segnale MACD, la classificazione delle candele colorate e le frecce direzionali in un unico strumento visivo per il trading.


Come Funziona l'Indicatore

1. Sistema di Candele Colorate

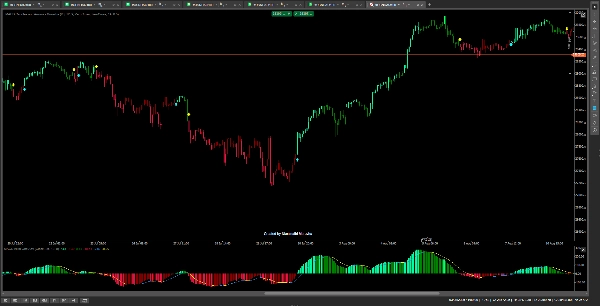
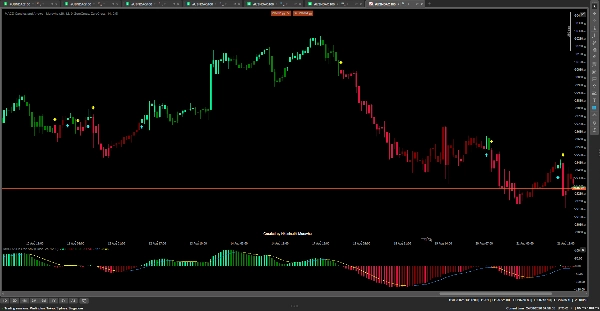
Le candele sono colorate automaticamente secondo la modalità selezionata.

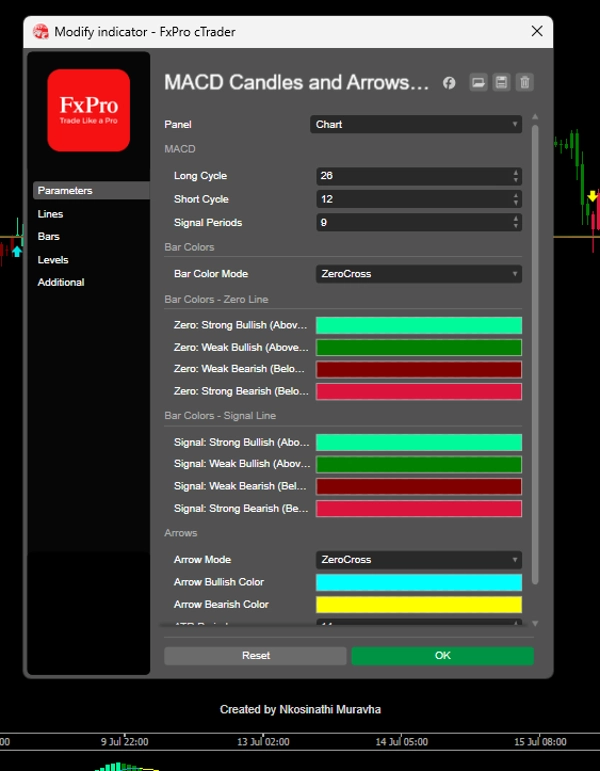
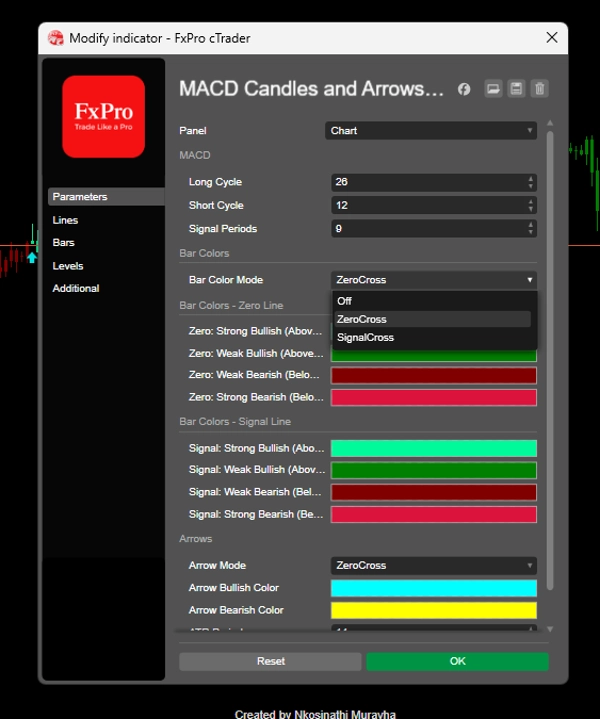
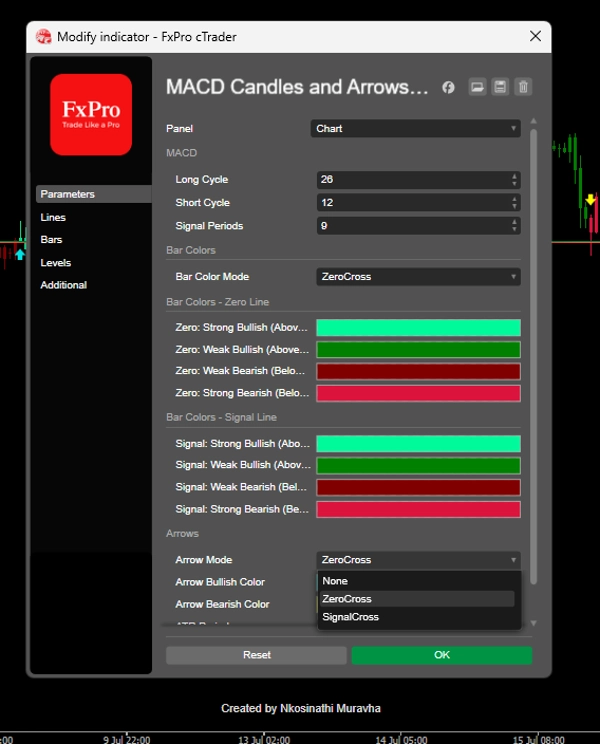
Modalità Zero-Cross valuta due aspetti:

  • Se l'istogramma MACD è sopra o sotto la linea zero.
  • Se il momentum dell'istogramma sta aumentando o diminuendo rispetto alla barra precedente.

Questo permette ai trader di vedere non solo la direzione attuale, ma anche se il momentum si sta rafforzando o indebolendo.

2. Modalità Signal-Cross

La modalità alternativa di colore delle candele confronta la linea MACD con la sua linea di segnale e misura se la distanza tra di esse si sta allargando o restringendo.

3. Frecce di Trading

L'indicatore può generare frecce utilizzando sia i Cross della Linea Zero sia i Cross tra MACD e Linea di Segnale.


Un trader può usarlo per:

  1. Identificare il momentum rialzista e ribassista.
  2. Rilevare i crossover della linea zero o della linea di segnale MACD.
  3. Riconoscere quando il momentum si sta rafforzando o indebolendo.
  4. Usare i colori delle candele per confermare la direzione di un potenziale trade.
  5. Usare le frecce per evidenziare potenziali cambiamenti di direzione.
  6. Combinare i segnali con l'azione del prezzo, supporto/resistenza, analisi del trend o altri metodi di conferma.


Riepilogo

Riepilogo AI
MACD Candles and Arrows - Muravha is a momentum and trend-confirmation indicator that integrates MACD histogram analysis, signal-line crossovers, color-coded candles, and directional arrows into a single visual tool on the price chart. It offers two candle-color modes: Zero-Cross Mode, which evaluates whether the MACD histogram is above or below zero and whether momentum is rising or falling; and Signal-Cross Mode, which compares the MACD line with its signal line to assess the widening or narrowing distance between them. The indicator generates arrows based on either zero-line crosses or MACD/signal-line crosses to highlight potential directional changes. Traders can use this indicator to identify bullish and bearish momentum, detect MACD crossovers, recognize momentum strength or weakness, and confirm trade direction through candle colors and arrows. It is designed to complement other analysis methods such as price action, support/resistance, and trend analysis. The product supports visualization, filtering, and signal outputs based on bar data and is categorized under momentum indicators.
Profilo indicatore
Categoria indicatore
Momentum
Tipo di output
Filtro
Segnali
Visualizzazione
Requisiti per i dati
Solo barre
Segnali supportati
Superamento
Rottura
Inversione

Discussioni

Recensioni dei clienti

4.5
Recensioni: 2
5
50 %
4
50 %
3
0 %
2
0 %
1
0 %
Recensioni dei clienti
October 24, 2026
Separate modes for histogram zero crosses and MACD signal line crosses are an excellent detail, while candle colours independently show strengthening or fading momentum instead of making every colour change mean the same event as an arrow.
October 1, 2026
The colours and arrows have clearly different jobs, with candle shading tracking momentum strength and the chosen arrow mode following either histogram zero crossings or MACD signal line crosses.

Domande frequenti

MACD
I prodotti disponibili tramite cTrader Store, inclusi bot di trading, indicatori e plugin, sono forniti da sviluppatori terzi e resi disponibili esclusivamente a scopo informativo e di accesso tecnico. cTrader Store non è un broker e non fornisce consulenze in materia di investimento, raccomandazioni individualizzate o garanzie di risultati futuri.

Altro da questo autore

Indicatore
Prop
Forex
+12
Trend Riding Indicator
Indicatore
Ichimoku
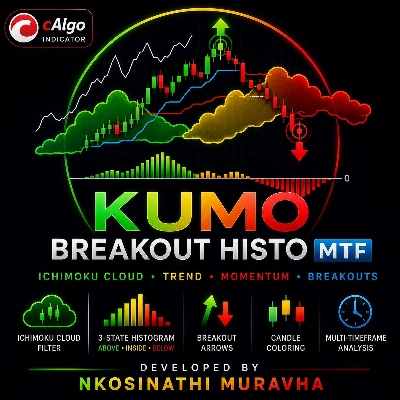
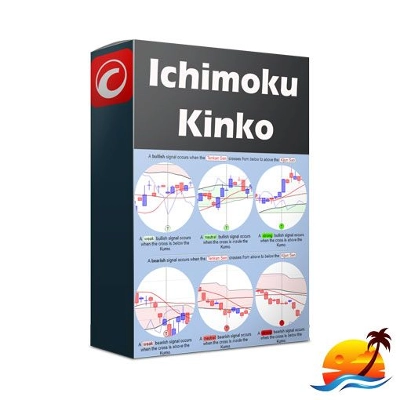
Identifies Ichimoku cloud breakouts, trend direction, and momentum to highlight potential buy and sell opportunities.

Potrebbe interessarti anche

Indicatore
Prop
Forex
+5
Tick Imbalance Bars Indicator - brings institutional-grade market microstructure analysis to cTrader.
Indicatore
Signal
XAUUSD
The HAI Quantum V10 is an advanced indicator designed for technical analysis.
Indicatore
VWAP
Volume
+1
Four click-anchored VWAP lines with HTF mode, switchable line types, bands and overshoot. Fast, clean, no repaint.
Indicatore
ATR
RSI
+14
🚀 The DEFINITIVE indicator for making HIGHLY ACCURATE entries 🎯
Indicatore
AI
ATR
+27
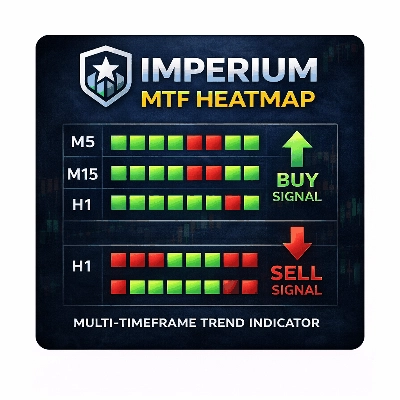
Imperium MTF Heatmap is a unique top-tier indicator for cTrader, created for traders who want more than signals
Indicatore
Prop
Forex
+15
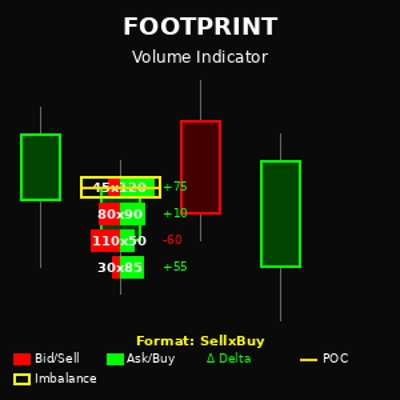
Footprint volume indicator showing bid/ask splits at each price level
Logo di "BvsB 2026"
Più votato
4.7
(4)
$100
Indicatore
Prop
Forex
+1
Smart support/resistance indicator with rejection-only Buy/Sell signals designed for H1 charts.
Indicatore
Liquidity Grab
Liquidity Sweep
+2
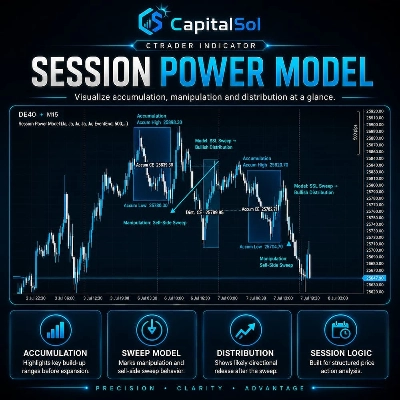
Visualizes accumulation ranges, manipulation sweeps and distribution phases on your cTrader chart.
Indicatore
BTCUSD
EURUSD
+7
Pure Market Structure, Catching the Algo of Institutional move, Stay in the Game !! & know what's gonna happen Next.
Indicatore
Forex
Crypto
+4
This indicator has an in built strategy analyzer that analyze the markets and generates quality signals.
Indicatore
ATR
EMA
+3
High-Tech 3-Level Squeeze Detection with HTF Filter, Carter Entry/Exit Rules, Signal Quality Grading & Real-Time
Indicatore
Key Levels
Breaker Block
+5
ICT breaker blocks on 4 timeframes in one chart. Validity tracking, on-chart panel, alerts. Multi-platform bonus.
Indicatore
Prop
Stocks
+4
High-Performance Renko Chart Indicator with Advanced filtering method - built for Renko and candlestick charts.
Indicatore
Order Block
Supply & Demand
+2
Professional MTF dashboard aggregating and clustering Supply & Demand zones from multiple timeframes in cTrader.
Indicatore
ADX
ATR
+5
HAI QUANTUM V7.0 | The Stochastic Drift & Gravity Edition The Most Advanced Neural-Ready Trading Dashboard for cTrader
Indicatore
Key Levels
Order Block
+3
Professional indicator for automated detection and dynamic tracking of Supply & Demand zones in cTrader.
Indicatore
ADX
ATR
+3
Precision sniper-style confluence entries with graded signals, auto SL/TP & live backtest — 7 presets, MTF bias.
Indicatore
ATR
Imbalance
+5
Chart analyzer, Multi time frame, hybrid strategies and timeframe

Prezzo

4.15M
Volume negoziato
39.99K
Profitto in pip
1
Vendite