คำอธิบาย
ภาพรวมตัวชี้วัด
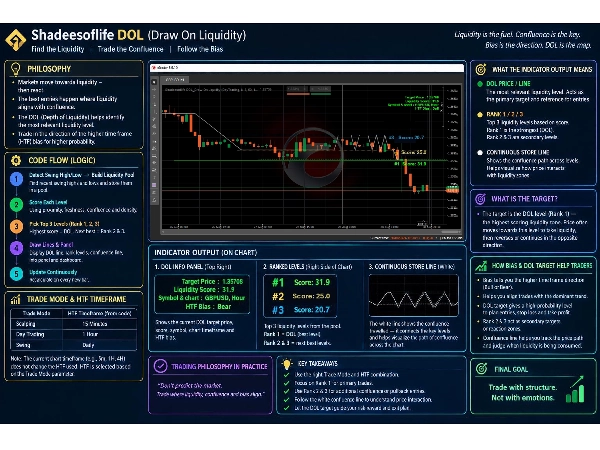
ตัวชี้วัด Shadeesoflife DOL (Draw on Liquidity) c Trader ให้เครื่องยนต์ระบุเป้าหมายแบบไดนามิกโดยอิงตามแนวคิด Smart Money Concepts (SMC) และหลักการ ICT โดยจะวาดเส้นบน Liquidity (DOL), จัดอันดับ และติดตามกลุ่มสภาพคล่องเชิงโครงสร้าง - "การรวมตัวสูง" ทั่วตลาดในทุกการเคลื่อนไหว DOL เป็นเป้าหมายแบบไดนามิก สภาพคล่องที่มีการรวมตัวสูง
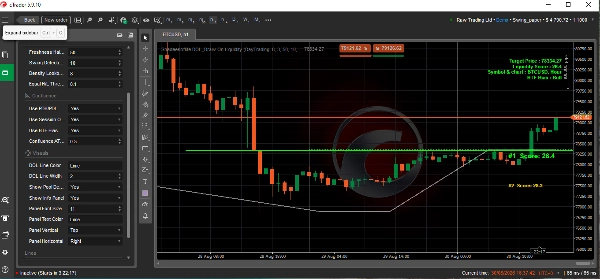
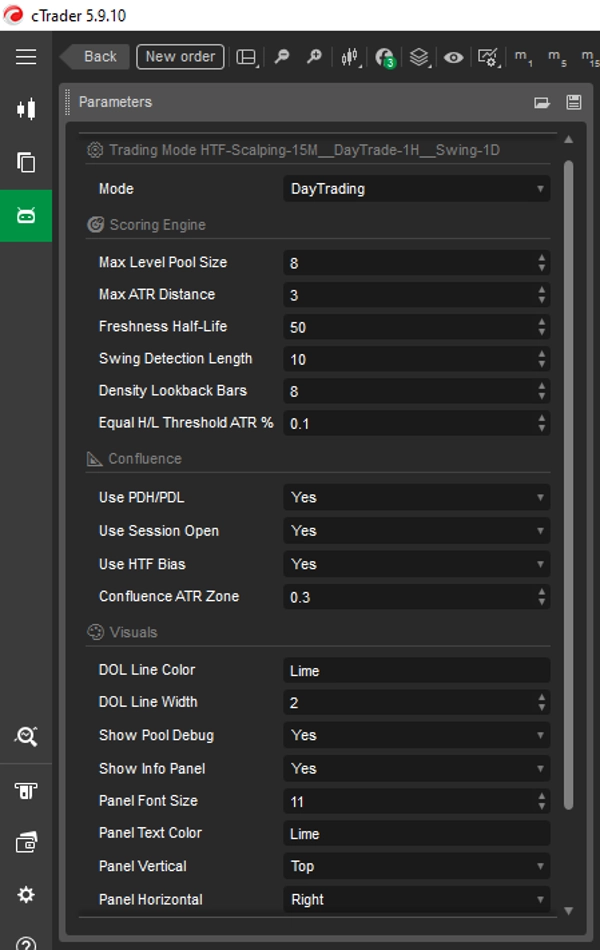
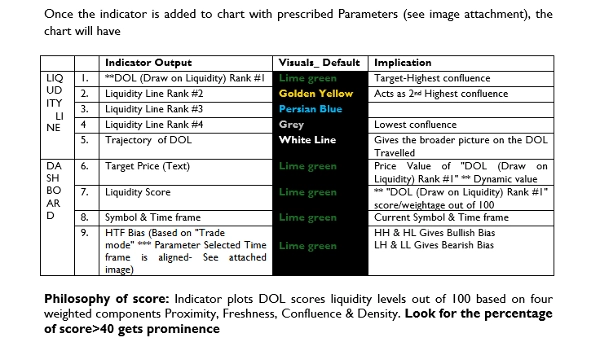
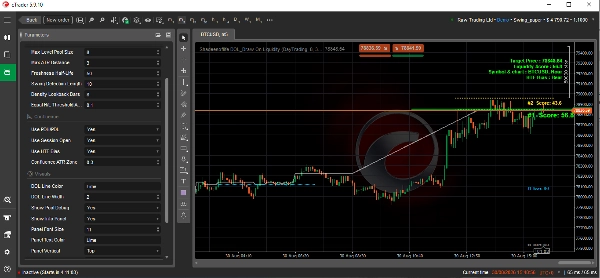
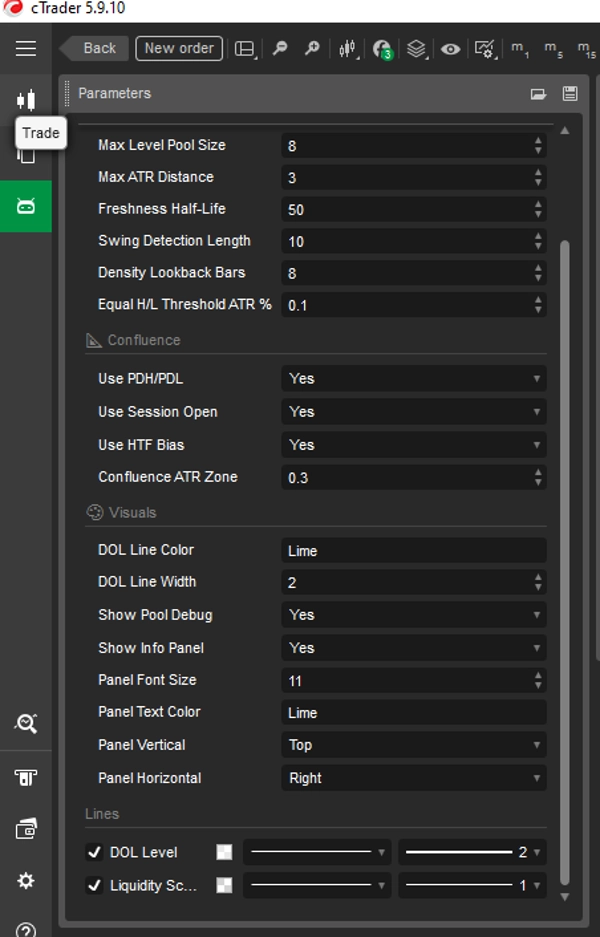
ตัวชี้วัดจะแสดงเป้าหมายหลักของ DOL (ระดับที่ได้คะแนนสูงสุด แสดงเป็นเส้นเด่น) พร้อมกับกลุ่มเป้าหมายสภาพคล่องรองที่จัดอันดับไว้ และแสดงแผงบนหน้าจอที่แสดงอคติ HTF ปัจจุบันและเมตริกเป้าหมาย เมื่อเพิ่มตัวชี้วัดลงในแผนภูมิตามพารามิเตอร์ที่กำหนด (ดูภาพแนบ) แผนภูมิจะมี
สำหรับคำตอบ- ดูภาพแนบ (ตาราง)
ปรัชญาของคะแนน: ตัวชี้วัด แสดงคะแนน DOL ระดับสภาพคล่องจาก 100 โดยอิงจากสี่ส่วนประกอบที่มีน้ำหนัก ความใกล้เคียง, ความสดใหม่, การรวมตัว & ความหนาแน่น
คำถามที่พบบ่อย
1. วิธี ทำงานอย่างไร - กรอบกลยุทธ์หลายกรอบเวลา HTF & LTF??
การระบุอคติและทิศทางของกรอบเวลาที่สูงกว่า (HTF)
ตัวชี้วัด กำหนดอคิโครงสร้างโดยใช้การเลือกโหมดการเทรดพื้นฐานเพื่ออ้างอิงกรอบเวลาที่สูงกว่า (เช่น ***รายวันสำหรับ Swing, 1 ชั่วโมงสำหรับ Day Trading, 15 นาทีสำหรับ Scalping):
- อคติ HTF ขาขึ้น:
- เงื่อนไข: แท่งเทียน HTF ปิดสูงกว่าราคาเปิด (HTF ขาขึ้น).
- พฤติกรรมตัวชี้วัด: เครื่องยนต์การให้คะแนนแสดงราคาตั้งเป้าหมาย (เส้นที่ติดแท็กคะแนน #1) อยู่ต่ำกว่าราคา Ask/bid (เป้าหมาย HTF แสดงสภาพคล่องภายในและราคาตั้งเป้าหมาย LTF แสดงสภาพคล่องภายนอก).
- นัยทางการเทรด: ราคากำลังมองหาสภาพคล่องฝั่งขาย (SSL) ด้านล่างเพื่อการปรับฐานลดราคาก่อนจะขึ้นต่อ หรือ ตั้งเป้าหมายสภาพคล่องฝั่งซื้อ (BSL) ด้านบนเป็นเป้าหมายขยายสุดท้าย.
- อคติ HTF ขาลง:
- เงื่อนไข: แท่งเทียน HTF ปิดต่ำกว่าราคาเปิด (HTF ขาลง).
- พฤติกรรมตัวชี้วัด: เครื่องยนต์การให้คะแนนแสดงราคาตั้งเป้าหมาย (เส้นที่ติดแท็กคะแนน #1) อยู่สูงกว่าราคา Ask/bid (เป้าหมาย HTF แสดงสภาพคล่องภายในและราคาตั้งเป้าหมาย LTF แสดงสภาพคล่องภายนอก).
- นัยทางการเทรด: ราคากำลังมองหาสภาพคล่องฝั่งซื้อ (BSL) ด้านบนเพื่อการปรับฐานเพิ่มราคาก่อนจะลงต่อ หรือ ตั้งเป้าหมายสภาพคล่องฝั่งขาย (SSL) ด้านล่าง.
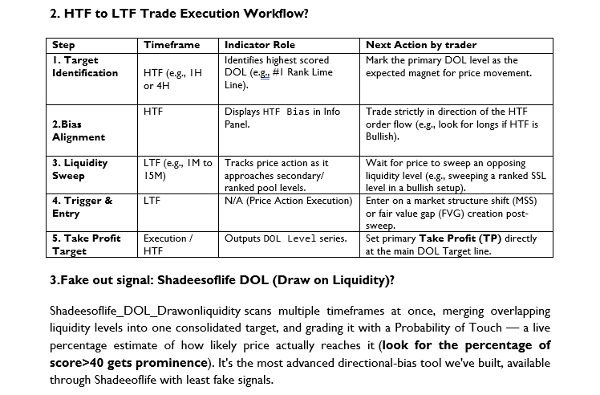
2. กระบวนการดำเนินการเทรดจาก HTF ถึง LTF?
สำหรับคำตอบ- ดูภาพแนบ (ตาราง)
3. สัญญาณปลอม: Shadeesoflife DOL (Draw on Liquidity)?
"Shadeesoflife DOL Draw on liquidity" สแกนหลายกรอบเวลาในครั้งเดียว รวมระดับสภาพคล่องที่ทับซ้อนกันเป็นเป้าหมายเดียวที่รวมกัน และให้คะแนนด้วยความน่าจะเป็นที่จะสัมผัส — การประมาณเปอร์เซ็นต์สดของความน่าจะเป็นที่ราคาจะถึงเป้าหมายจริง (ดูเปอร์เซ็นต์ของคะแนน>40 จะโดดเด่น). นี่คือเครื่องมืออคติทิศทางที่ล้ำหน้าที่สุดที่เราสร้างขึ้น มีให้ผ่าน Shadeeoflife โดยมีสัญญาณปลอมน้อยที่สุด.
4. การทำงานของ Confluence ในเทคนิค "Shadeesoflife DOL Draw on liquidity" คืออะไร?
"Shadeesoflife DOL Draw on liquidity" สแกนสภาพคล่องภายใน, สภาพคล่องภายนอก, บล็อกคำสั่ง, บล็อกเบรกเกอร์, FVGs, iFVGs, และ BSL/SSL สำหรับอคติทิศทางของมัน DOL Pro ทำงานบนเครื่องยนต์ที่แตกต่างอย่างสิ้นเชิง — มันสแกน EQH/EQL, FVGs ขนาดใหญ่, ขอบเขตเซสชัน, PDH/PDL, และช่องว่างช่วงกลางคืน/สุดสัปดาห์ในหลายกรอบเวลา อ่านอคติของเซสชันเช่นจังหวะ Judas และการต่อเนื่อง และให้คะแนนเป้าหมายด้วยความน่าจะเป็นที่จะสัมผัสแบบสด ด้วยอัลกอริทึมที่ชาญฉลาดกว่า มีภารกิจอคติทิศทางเหมือน DOL สร้างบนเครื่องยนต์ที่เข้มงวดกว่า ให้ผลลัพธ์ของการตั้งค่าความน่าจะเป็นสูงโดยให้ทิศทางและเป้าหมายการรวมตัวสูงของราคา
อ่านหลายกรอบเวลาในครั้งเดียว ไม่ใช่แค่หนึ่งเดียว, สแกน EQH/EQL, FVGs ขนาดใหญ่, ขอบเขตเซสชัน, PDH/PDL, และช่องว่างช่วงกลางคืน/สุดสัปดาห์ อ่านอคติของเซสชัน — รูปแบบเช่นจังหวะ Judas และการต่อเนื่อง
┌──────────────────────────────────────┐
│ แนวคิด ICT / สภาพคล่อง │
│ DOL • PDH • PDL • เซสชัน • HTF │
│ สภาพคล่อง • Equal High/Low │
└──────────────────┬───────────────────┘
↓
┌──────────────────────────────────────┐
│ ชั้นโครงสร้าง / SMC │
│ Swing High • Swing Low │
│ กลุ่มสภาพคล่อง • ทิศทาง HTF │
└──────────────────┬───────────────────┘
↓
┌─────────────────────────────────────────┐
│ เครื่องยนต์คำนวณ SHADEESOFLIFE │
│ ความใกล้เคียง X% + ความสดใหม่ Y% + การรวมตัว Z% + ความหนาแน่น A% │
│ │
│ → คะแนน 0–100 → อันดับ #1/#2/#3 → DOL แบบไดนามิก │
└─────────────────────────────────────────┘
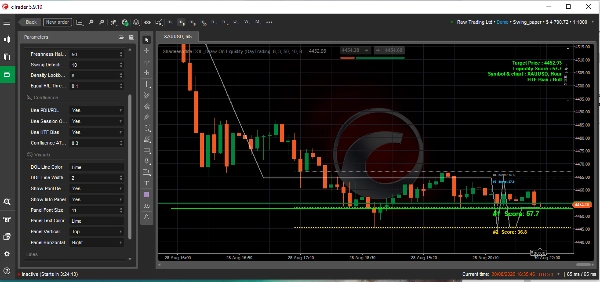
📊 การวิเคราะห์แผนภูมิทางเทคนิค (การตีความภาพแนบ)
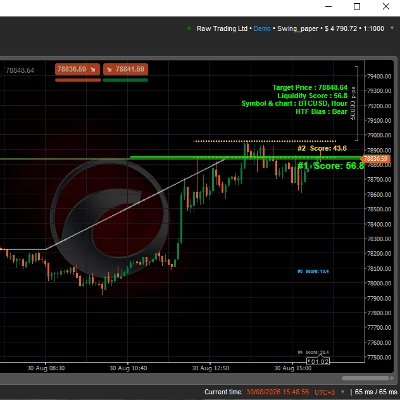
แผนภูมินี้จากแพลตฟอร์มการเทรด cTrader แสดง BTCUSD (Bitcoin / ดอลลาร์สหรัฐ) บนกรอบเวลา 5 นาที (m5) มีตัวชี้วัดโครงสร้างตลาดอัตโนมัติที่กำหนดเองชื่อว่า "Shadeesoflife DOL Draw On Liquidity" ซึ่งตั้งค่าด้วยแนวคิด Smart Money Concepts (SMC).
🔎 เมตริกและการวิเคราะห์ทางเทคนิคหลัก
- ราคาปัจจุบัน: สินทรัพย์กำลังซื้อขายที่ 78,856.48 อยู่ในช่วงแคบที่มีสภาพคล่องสูงอย่างเข้มงวด
- ราคาตั้งเป้าหมาย / Draw on Liquidity (DOL): แสดงด้วยเส้นสีเขียวสดแนวนอนที่ 78,848.64 ซึ่งทำหน้าที่เป็นแม่เหล็กเด่นสำหรับการเคลื่อนไหวของราคา
- คะแนนสภาพคล่อง (57.3): คะแนนปานกลางที่บ่งชี้คำสั่งสถาบันที่มั่นคงแต่ไม่ล้นหลามรอบๆ จุดนี้
- อคติกรอบเวลาที่สูงกว่า (HTF): ระบุชัดเจนว่าเป็นขาลง (Bear) ระบบกำลังมองหาการต่อเนื่องลงเมื่อสภาพคล่องฝั่งซื้อที่พักอยู่ถูกเคลียร์
- คะแนนลำดับความสำคัญของอัลกอริทึม:
- คะแนน #1 (57.3): อยู่ที่เส้นเป้าหมายสีเขียวโดยตรง
- คะแนน #2 (45.8): พักอยู่สูงขึ้นเล็กน้อยที่ระดับเส้นฐานสีแดง
💡 การตีความกลยุทธ์หลัก
ตัวชี้วัดกำลังวางแผนการตั้งค่า SMC คลาสสิกที่เครื่องยนต์ตลาด มุ่งหมายที่จะกวาดกลุ่มสถาบันเฉพาะ
- ผลกระทบแม่เหล็ก: ราคาขึ้นไปยังโซนพรีเมียมและกำลังดึงดูดอย่างหนักไปยังเส้นฐานสีเขียว Draw on Liquidity (DOL) ที่ 78,848.64
- การสอดคล้องแนวโน้ม: เนื่องจากอคิโครงสร้าง HTF เป็นขาลง การดึงลงท้องถิ่นนี้ไปยังเส้น DOL สอดคล้องอย่างสมบูรณ์แบบกับแนวโน้มหลัก
- การเคลียร์สภาพคล่อง: เมื่อราคาตั้งเป้าและลดสภาพคล่องที่พักอยู่ที่เส้นสีเขียวนี้ เทรดเดอร์มักจะเฝ้าดูการเบรกโครงสร้างที่เด็ดขาดหรือการต่อเนื่องอย่างรุนแรงของทิศทางขาลงในภาพรวม
หมายเหตุ:
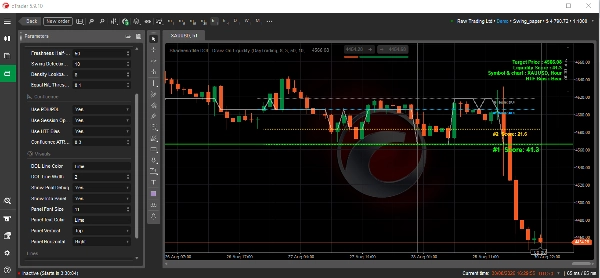
- สามารถใช้กับ BTCUSD, XAUUSD, GBPUSD หรือสัญลักษณ์ใดก็ได้
- การวิเคราะห์ BTCUSD ข้างต้นอิงตามแผนภูมิ LTF 5m (เลือกแผนภูมิด้วยตนเอง) และ HTF 1DAY (พารามิเตอร์ “Trade Mode” สำหรับ Day trade จากเมนูดรอปดาวน์).
- ตัวชี้วัดสามารถใช้ได้กับ (พารามิเตอร์ “Trade Mode” เลือกให้สอดคล้องกับกรอบเวลาเพื่อ BIAS)
- Scalping- HTF 15M, (ค่าเริ่มต้น)
- Day trade- HTF 1H,
- Swing trade- HTF 1D,
- เทรดสี่ชั่วโมง- HTF 4H
- พารามิเตอร์ "Show pool debug" สามารถใช้ปิดเส้นเป้าหมายการรวมตัวที่ไม่สำคัญยกเว้นอันดับ #1
- พารามิเตอร์ "Show info panel" สามารถใช้ปิดเพื่อซ่อนแผงข้อมูล
- "Panel" สามารถปรับแต่งขนาดตัวอักษร สีข้อความ และตำแหน่งแผง (ตำแหน่งแนวนอน/แนวตั้ง)
- ตำแหน่งเส้น "DOL level" บนแกน X (ราคา) แสดงเส้นเป้าหมายการรวมตัวอันดับ #1 ที่แกน Y (เวลา) ที่เกี่ยวข้อง
สรุป
The indicator outputs a primary Draw on Liquidity (DOL) target line representing the highest-scored liquidity level, along with secondary ranked targets. It provides an on-screen panel displaying higher timeframe (HTF) bias and target metrics, supporting trading styles from scalping to swing trading by referencing appropriate HTFs (e.g., 15-minute for scalping, daily for swing).
Shadeesoflife DOL integrates multi-timeframe analysis, scanning equal highs/lows, fair value gaps, session boundaries, previous day highs/lows, and gaps to assess directional bias and price magnet levels. It calculates a live Probability of Touch (PoT) percentage estimating the likelihood of price reaching each target.
Traders use the indicator to align trades with HTF bias, identify liquidity sweeps on lower timeframes, and set entries and take profit targets at ranked liquidity pools. It supports markets including BTCUSD and XAUUSD and offers customizable display options for target lines and info panels.






!["[Stellar Strategies] Smart ADX" โลโก้](https://cdn.ctrader.com/image/webp/af13b084-b6f6-41db-b7bc-c7e688b57b05_36929)