Automatic Fibonatti - Renko
Indikator
Versi 1.0, Feb 2025
Windows, Mac
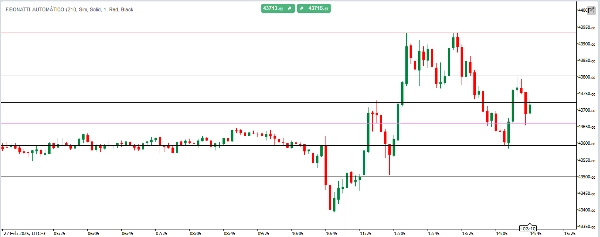
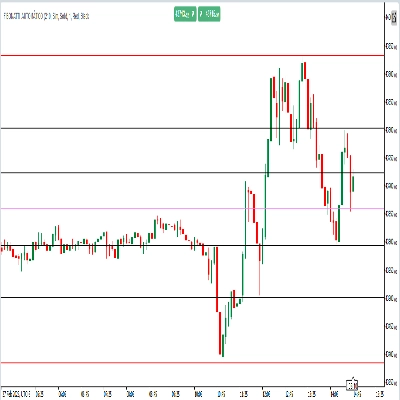
Auto Fibonacci RENKO untuk cTrader
Secara automatik mengenal pasti tahap harga utama — boleh disesuaikan sepenuhnya mengikut strategi anda.
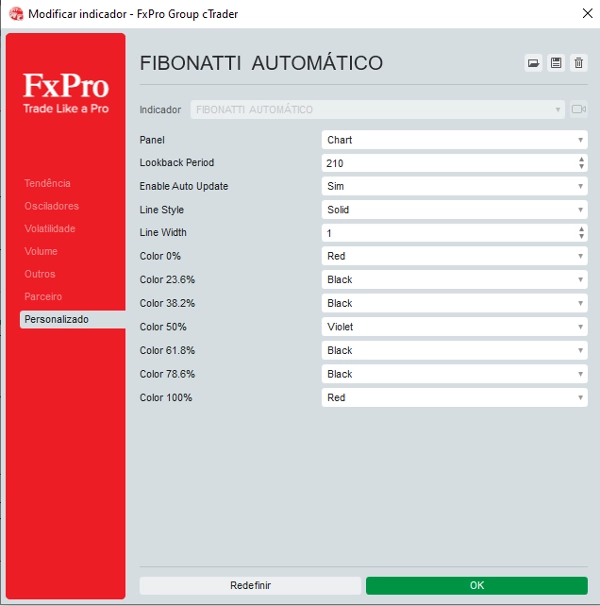
Auto Fibonacci adalah penunjuk pintar dan fleksibel yang secara automatik melukis tahap retracement Fibonacci berdasarkan harga tertinggi dan terendah sepanjang tempoh yang ditetapkan pengguna. Apa yang membezakannya adalah penyesuaian penuh: peribadikan setiap tahap Fibonacci dari segi warna, gaya garis, dan ketebalan mengikut keutamaan visual dan strategi perdagangan anda. Ia juga mempunyai ciri kemas kini masa nyata, jadi carta anda sentiasa mencerminkan tindakan harga terkini — tiada penyesuaian manual diperlukan.
Profil indikator
0.0
Ulasan: 0
Ulasan pelanggan
Belum ada ulasan untuk produk ini. Anda sudah mencuba produk tersebut? Jadilah yang pertama untuk berkongsi pendapat anda!
Produk yang tersedia melalui cTrader Store, termasuk bot dagangan, indikator dan plugin, disediakan oleh pembangun pihak ketiga dan diberikan akses untuk tujuan maklumat dan teknikal sahaja. cTrader Store bukan broker dan tidak memberikan nasihat pelaburan, syor peribadi atau sebarang jaminan prestasi masa hadapan.


Sejak 05/02/2025
30
Jualan