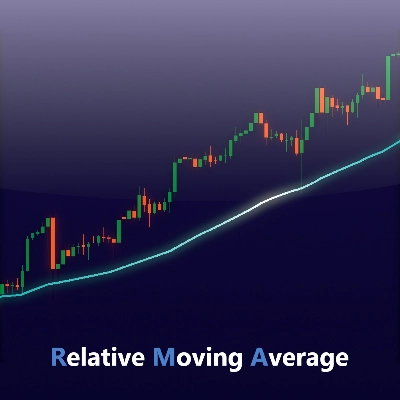
Vorstellung des Relative Moving Average (RMA) Indikators, jetzt verfügbar für cTrader!
Der Relative Moving Average (RMA) — auch bekannt als Smoothed Moving Average (SMMA) — ist eine Art gleitender Durchschnitt, der darauf abzielt, Verzögerungen zu reduzieren und gleichzeitig die Glätte der Kurve beizubehalten. Es ist die gleiche Formel, die von TradingViews eingebauter „RMA“-Funktion verwendet wird, die in beliebten Indikatoren wie dem Relative Strength Index (RSI) weit verbreitet ist.
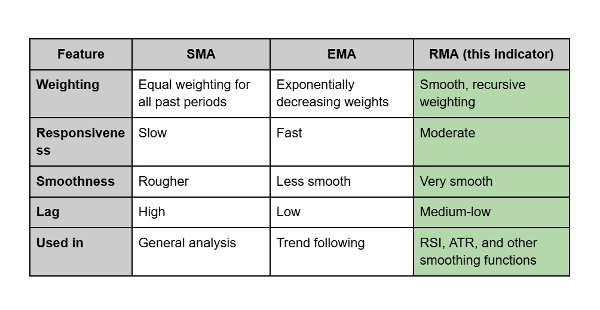
Der RMA ist darauf ausgelegt, ein Gleichgewicht zwischen Reaktionsfähigkeit und Stabilität zu schaffen. Er aktualisiert sich glatter als ein Exponential Moving Average (EMA), reagiert aber schneller auf Kursänderungen als ein Simple Moving Average (SMA).
Wie er sich unterscheidet:
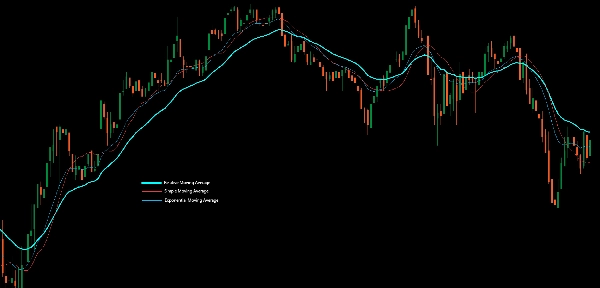
- Der SMA gewichtet alle Preise gleich, was zu Verzögerungen und Schwankungen führt.
- Der EMA legt mehr Gewicht auf jüngste Preise, wodurch er sehr reaktionsschnell, aber manchmal auch rauschhaft ist.
- Der RMA hingegen vereint die Vorteile beider: Er glättet die Volatilität und bewahrt gleichzeitig zeitnahe Reaktionen auf Kursänderungen.
Praktische Anwendung:
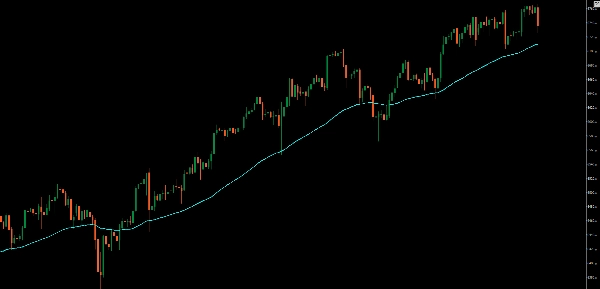
Trader verwenden den RMA oft als glattere Trendlinie oder als Teil von Momentum-Indikatoren. Er ist besonders effektiv, wenn man Rauschen filtern möchte, ohne signifikante Verzögerungen einzuführen — ideal zur Bestätigung von längerfristigen Trends oder zur Unterstützung von Überkauft-/Überverkauft-Analysen.


