
Açıklama
📌 Kalman Filtresi Trend – Genel Bakış & İnceleme
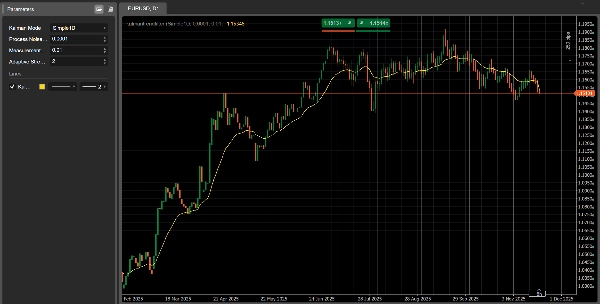
Kalman Filtresi Trend, cTrader için gelişmiş bir trend takip göstergesidir ve geleneksel hareketli ortalamalara kıyasla önemli ölçüde daha az gecikmeyle pürüzsüz, yüksek duyarlılığa sahip bir trend çizgisi sunmak üzere tasarlanmıştır.
Klasik SMA/EMA filtreleri yavaş tepki verir ve genellikle erken trend değişikliklerini kaçırırken, Kalman Filtresi:
- “Gerçek” fiyat tahminini sürekli günceller
- Pürüzsüzlük ve duyarlılığı matematiksel olarak dengeler
- Volatiliteye uyum sağlar (Uyarlanabilir mod)
- Hem fiyatı hem de hızı modeller (2B mod)
Bu da onu hem manuel traderlar hem de otomatik sistem geliştiricileri için güçlü bir araç yapar.
🎛 Modlar & Parametreler
Kalman Modu (Bir Göstergede 3 Versiyon)
1️⃣ Simple1D
Klasik bir 1B Kalman filtresi.
Hızlı, temiz ve kısa vadeli trend tespiti için mükemmel.
2️⃣ PositionVelocity2D
Hem fiyatı hem de trend hızını modeller.
Algoritmik stratejilerde yön filtresi olarak idealdir.
3️⃣ Adaptive1D
Volatiliteye otomatik olarak uyum sağlar.
Hızlı piyasalarda daha tepkisel, sakin koşullarda daha pürüzsüzdür.
🧩 Temel Parametreler Açıklaması
- İşlem Gürültüsü (Q):
Yüksek = daha hızlı trend tepkisi, düşük = daha pürüzsüz çizgi. - Ölçüm Gürültüsü (R):
Yüksek = filtre veriye daha az güvenir → daha pürüzsüz sonuç. - Uyarlanabilir Güç:
Sadece Adaptive1D’de kullanılır. Volatilitenin filtreyi ne kadar etkilediğini kontrol eder.
📈 Sinyaller Nasıl Yorumlanır
1. Trend Yönünün Tespiti
- Yükselen Trend: Çizgi yukarı eğimli, fiyat filtrenin üzerinde.
- Düşen Trend: Çizgi aşağı eğimli, fiyat filtrenin altında.
- Yatay: Piyasa yatay seyrediyor, kırılma stratejilerinden kaçının.
2. Giriş Sinyalleri (Kesişim Mantığı)
Boğa Girişi:
- Fiyat, Kalman çizgisinin üzerinde kapanır
- Çizgi yukarı doğru dönmeye başlar
Ayı Girişi:
- Fiyat, Kalman çizgisinin altında kapanır
- Çizgi aşağı doğru dönmeye başlar
3. Trend Gücü (2B Mod)
Eğim, momentumun doğrudan bir göstergesi haline gelir:
- Güçlü yukarı eğim → güçlü boğa trendi
- Güçlü aşağı eğim → güçlü ayı trendi
- Eğim düzleşiyor → trend zayıflıyor veya geçiş aşamasında
📊 Pratik Kullanım Örnekleri
✔ Trend Takip Stratejisi
Simple1D veya Adaptive1D kullanın:
- Eğim pozitif olduğunda çizginin üzerinde alım yapın
- Eğim negatif olduğunda çizginin altında satış yapın
✔ Çoklu Zaman Dilimi Yaklaşımı
- Yön için H1’de Kalman kullanın
- Hassas girişler için M15’te Kalman kullanın
- Sadece daha yüksek zaman diliminin gösterdiği yönde giriş yapın
✔ Bot Entegrasyonu
Algoritmik ticaret için mükemmel:
- Eğim > 0 ise sadece uzun izin verin
- Eğim < 0 ise sadece kısa izin verin
- US500, NAS100, US2000 gibi volatil endeksler için Adaptive1D kullanın
🌟 Topluluğumuza Katılın
Erişim istiyorsanız:
- Her botumuz için özel optimizasyonlar
- Gelişmiş yapılandırma ipuçları
- Ticaret iyileştirmeleri
- Kişiselleştirilmiş teknik destek
- Güncellemeler ve yeni araçlar
👉 Profil sayfamda bulunan bağlantıya tıklayarak topluluğumuza katılın.
Orada tüm botlarımız için en iyi optimizasyon ayarlarını, düzenli olarak güncellenmiş şekilde bulacaksınız.
Özet
Müşteri değerlendirmeleri
5 | 0 % | |
4 | 100 % | |
3 | 0 % | |
2 | 0 % | |
1 | 0 % |


