Açıklama
TrendFallowing: cTrader platformu için birden fazla analitik yaklaşımı tek bir çözüme birleştiren gelişmiş bir teknik göstergedir. Gösterge yakınsaması yoluyla trend onayı arayan traderlar için geliştirilmiş olup, kesin sinyaller ve doğrulama filtreleri ile eksiksiz bir piyasa görünümü sunar.
OPERASYONEL STRATEJİ HAKKINDA TANITIM VİDEOSUNU İZLEYİN!
🎯 KULLANIM STRATEJİLERİ
1. Trend Takip İşlemi
Uygulama: Oluşmuş trendleri belirleyip takip etmek
Zaman dilimi: Uzun pozisyonlar için H4, D1
Ayarlar: ADX > 25, Ortalama üzeri hacim
Risk Yönetimi: 50 periyotluk hareketli ortalamanın altında stop-loss
2. Swing Trading
Uygulama: Orta vadeli hareketleri yakalamak
Zaman dilimi: H1, H4
Ayarlar: Hacim filtresi etkin, Hacim Profili ile onay
Hedefler: TP olarak Hacim Profili POC
3. Breakout Trading
Uygulama: Destek/direnç kırılışlarında giriş yapmak
Ayarlar: Hareketin gücünü doğrulamak için PVA hacmi
Onay: ADX yükseliyor + Ortalama üzeri hacim
4. Scalping (Daha Kısa Zaman Dilimleri)
Uygulama: Çoklu onaylarla hızlı işlemler
Zaman dilimi: M1, M5
Ayarlar: Katı hacim filtreleri ve Momentum
🔧 GÖSTERGELER NASIL ÇALIŞIR
ÇEKİRDEK ADX & DI
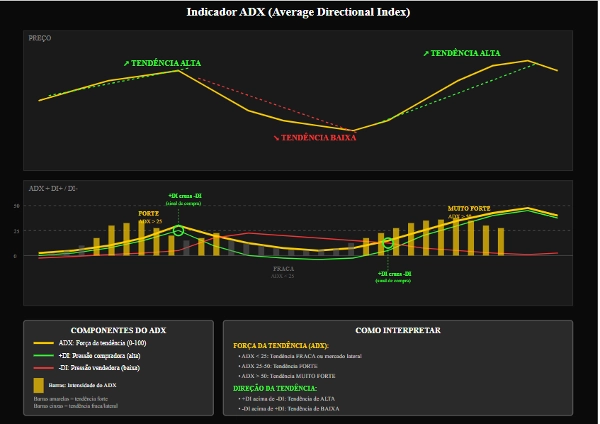
ADX (Ortalama Yön Endeksi)
Fonksiyon: Trend gücünü ölçmek
Yorumlama:
0-25: Zayıf trend/yatay hareket
25-50: Güçlü trend
50+: Çok güçlü trend
Pratik Kullanım: ADX < 20 olduğunda işlemlerden kaçının
+DI / -DI (Yön Göstergeleri)
+DI: Alıcı gücü
-DI: Satıcı gücü
Sinyal: +DI'nin -DI'nin üzerine çıkması (al) ve tersi
ADX Eğimi (ADX Slope)
Fonksiyon: Trend ivmesini ölçmek
Grafik: Camgöbeği histogram
Sinyal: Pozitif değerler güçlenen trendi gösterir
HACİM FİLTRELERİ
Hacim MA Filtresi
Fonksiyon: Ortalama üzeri hacimle sinyalleri doğrulamak
Parametreler: Periyot 20, Çarpan 1.0
Kullanım: Kurumsal ilginin onayı
PVA Hacmi (Fiyat Hacim Analizi)
Renkler ve Anlamları:
Yeşil: Çok yüksek hacimle alım (>%150 ortalama)
Mavi: Yüksek hacimle alım
Kırmızı: Çok yüksek hacimle satış
Pembe: Yüksek hacimle satış
Sarı: Destek kırılması ile Pin Bar/Tükenme
HACİM PROFİLİ
POC (Kontrol Noktası)
Fonksiyon: En yüksek işlem hacmine sahip fiyat
Kullanım: İşlemler için doğal hedef, dinamik destek/direnç
Değer Alanı
Fonksiyon: Hacmin %70'inin işlem gördüğü bölge
Yorumlama:
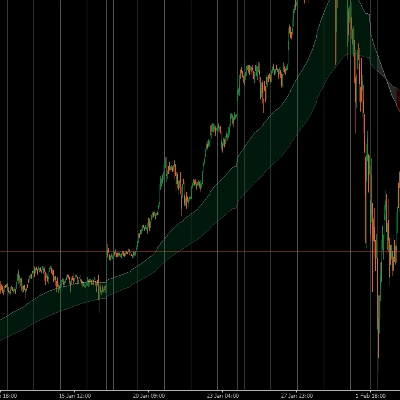
Fiyat üstünde: Yükseliş trendi
Fiyat altında: Düşüş trendi
İçinde: Olası yatay hareket
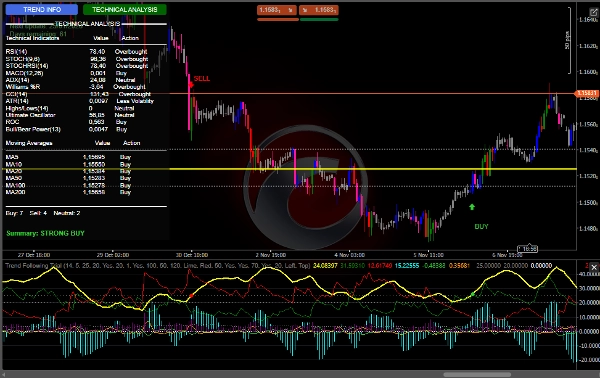
Gösterge Paneli
RSI: Aşırı satım (<30) / Aşırı alım (>70)
MACD: Momentum
Williams %R: Aşırı Koşullar
CCI: Dönüş Tespiti
Stokastik: Kısa vadeli Momentum
Ultimate Osilatör: Çok zaman dilimli Momentum
Hareketli Ortalamalar
Tam MA seti (5, 10, 20, 50, 100, 200)
Trendler için hizalama analizi
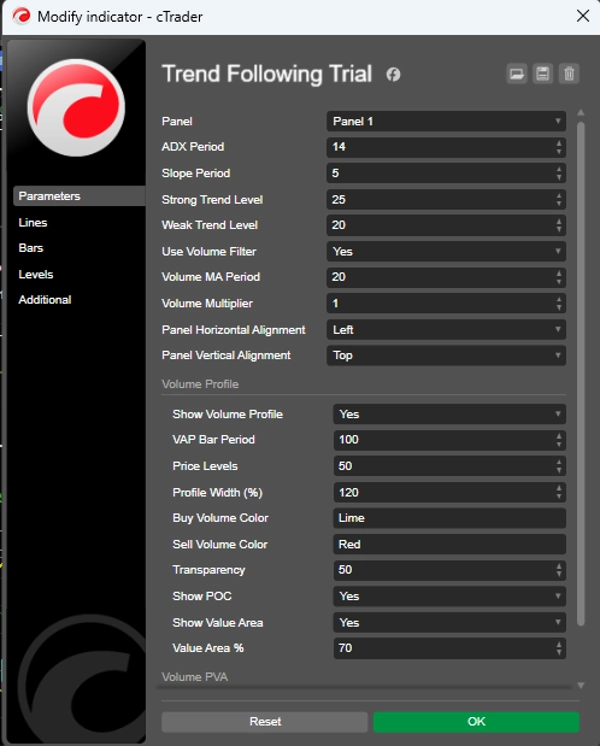
⚙️ ÖNERİLEN AYARLAR
Muhafazakar Ayar
ADX Periyodu: 14
Eğim Periyodu: 5
Güçlü Trend Seviyesi: 25
Zayıf Trend Seviyesi: 20
Hacim Filtresi Kullan: true
Hacim MA Periyodu: 20
Hacim Çarpanı: 1.2
Agresif Ayar
ADX Periyodu: 10
Eğim Periyodu: 3
Güçlü Trend Seviyesi: 20
Zayıf Trend Seviyesi: 15
Hacim Filtresi Kullan: true
MA Hacim Periyodu: 14
Hacim Çarpanı: 1.0
Hacim Profili (Önerilen)
Hacim Profilini Göster: true
VAP Bar Periyodu: 100
Fiyat Seviyeleri: 50
Değer Alanı %: 70
POC Göster: true
🎨 GÖRSEL KAYNAKLAR
Kullanıcı Arayüzü
Dinamik Panel: Gerçek zamanlı bilgi
Etkileşimli Butonlar: Analizler arasında geçiş
Sezgisel Renkler: İşlev bazlı kodlama
Grafiksel Sinyaller
Oklar: ALIŞ/SATIŞ girişleri
Sesler: Duyulabilir uyarılar
Bar Renkleri: Entegre PVA analizi