CursorbyteAutoFib v2
Gösterge
Sürüm 1.0, Apr 2025
Windows, Mac
Açıklama
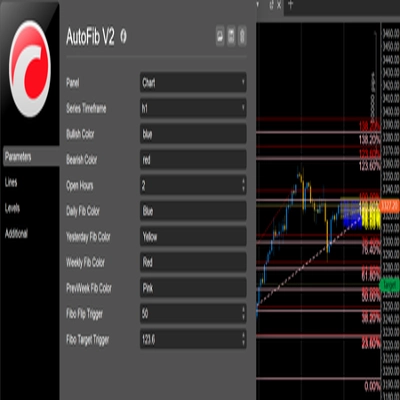
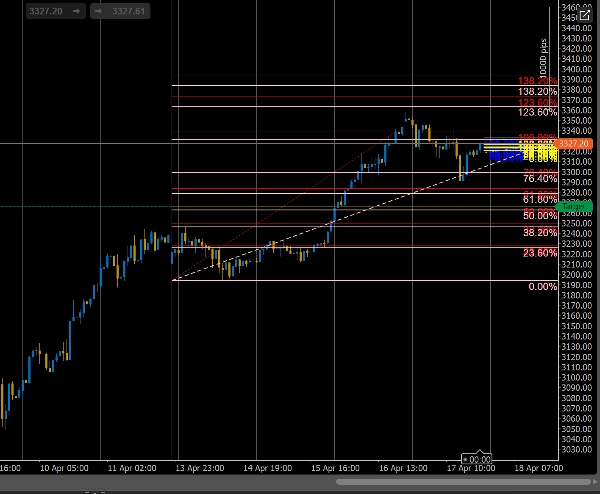
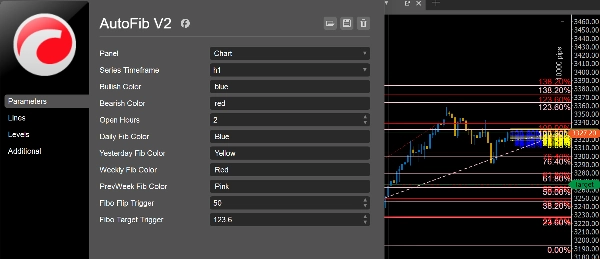
Bu cTrader göstergesi, son fiyat dalgalanmalarına dayalı olarak otomatik olarak Fibonacci düzeltme ve genişleme seviyelerini çizer. Tüccarların potansiyel destek, direnç ve hedef bölgelerini belirlemelerine yardımcı olur, böylece girişleri, çıkışları ve zarar durdurma yerleşimlerini hassasiyetle planlamak kolaylaşır.
Özet
Gösterge profili
Müşteri değerlendirmeleri
0.0
Değerlendirmeler: 0
Müşteri değerlendirmeleri
Bu ürün için henüz bir değerlendirme yok. Ürünü denediniz mi? O zaman ona dair görüşlerini paylaşan ilk kişi olun!
Tartışma
SSS
cTrader Store üzerinden erişilebilen işlem botları, göstergeler ve eklentiler gibi ürünler, üçüncü taraf sağlayıcılar tarafından sağlanır ve yalnızca bilgilendirme ve teknik erişim amaçlarıyla sunulur. cTrader Store bir broker değildir ve yatırım tavsiyesi, kişisel öneriler vermez veya gelecekteki performansı garanti etmez.


Fiyat
Başlangıç 31/10/2024
56
Satışlar
1.75K
Ücretsiz yüklemeler