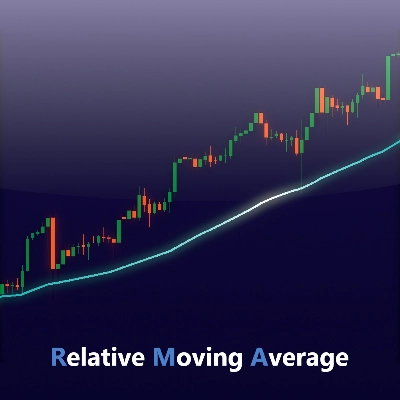
Представляем индикатор Relative Moving Average (RMA), теперь доступный для cTrader!
Индикатор Relative Moving Average (RMA) — также известный как Smoothed Moving Average (SMMA) — представляет собой тип скользящей средней, который стремится уменьшить запаздывание, сохраняя при этом плавность кривой. Это та же формула, что используется в встроенной функции “RMA” TradingView, широко применяемой в популярных индикаторах, таких как Relative Strength Index (RSI).
RMA разработан для баланса между отзывчивостью и стабильностью. Он обновляется более плавно, чем Exponential Moving Average (EMA), но реагирует на изменения цены быстрее, чем Simple Moving Average (SMA).
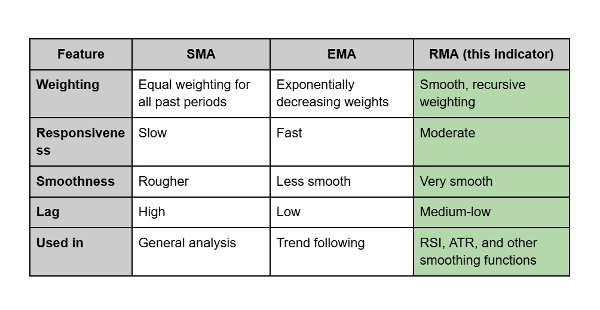
Чем отличается:
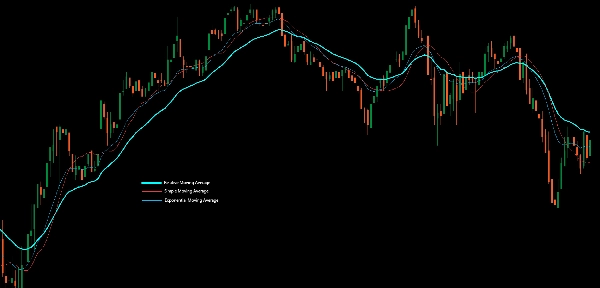
- Индикатор SMA усредняет все цены одинаково, что вызывает запаздывание и прерывистость.
- Индикатор EMA придаёт больший вес последним ценам, делая его очень отзывчивым, но иногда шумным.
- Индикатор RMA, напротив, сочетает преимущества обоих: он сглаживает волатильность, сохраняя своевременную реакцию на изменения цены.
Практическое применение:
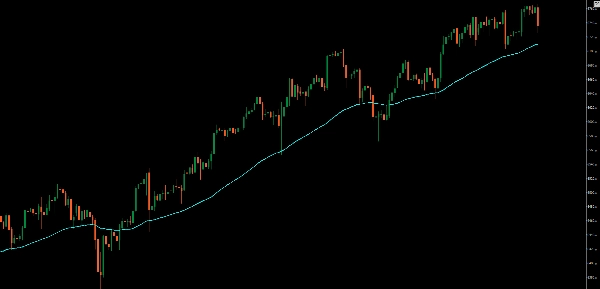
Трейдеры часто используют RMA как более плавную линию тренда или как часть индикаторов импульса. Он особенно эффективен, когда нужно отфильтровать шум без значительного запаздывания — идеально подходит для подтверждения долгосрочных трендов или поддержки анализа перекупленности/перепроданности.


