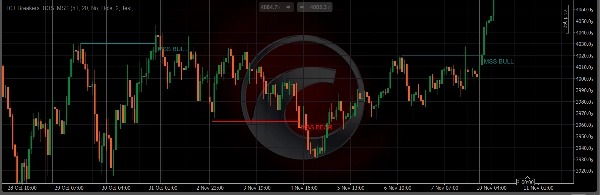
🚀 ICT Breakers (BOS/MSS) - Kuasai Pergeseran Struktur Pasar
Buka wawasan trading profesional dengan ICT Breakers, alat terbaik untuk mengidentifikasi perubahan struktur pasar yang krusial. Berdasarkan metodologi Institutional Composite Trader (ICT), indikator ini secara otomatis mendeteksi pola Break of Structure (BOS) dan Market Structure Shift (MSS) yang digunakan trader profesional untuk mengenali kelanjutan dan pembalikan tren.
🔥 Fitur Utama
🎯 Deteksi Sinyal Pintar
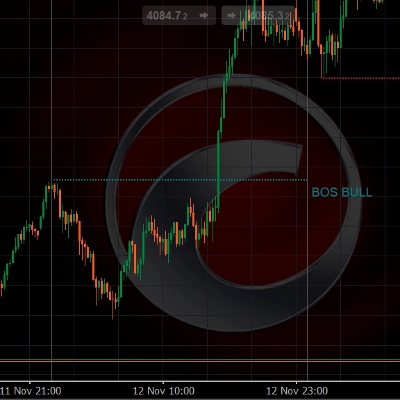
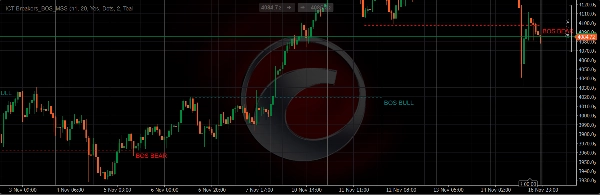
- Break of Structure (BOS): Mengidentifikasi sinyal kelanjutan tren
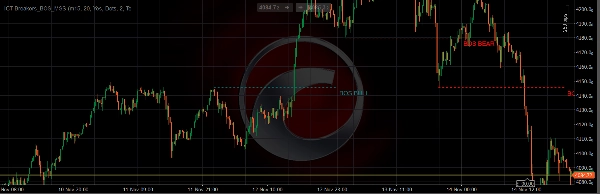
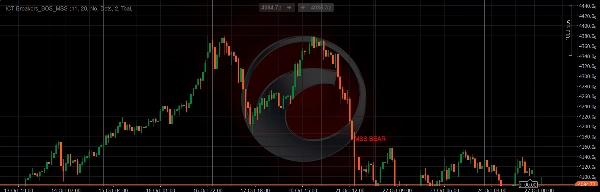
- Market Structure Shift (MSS): Menemukan titik potensi pembalikan tren
- Analisis Multi-Timeframe: Struktur timeframe lebih tinggi pada grafik timeframe lebih rendah
- Sensitivitas yang Dapat Disesuaikan: Sesuaikan parameter swing bar untuk deteksi optimal
🎨 Visualisasi Profesional
- Sinyal Berkode Warna: Warna berbeda untuk BOS dan MSS bullish/bearish
- Gaya yang Dapat Disesuaikan: Pilih dari garis solid, titik-titik, atau putus-putus
- Label Jelas: Setiap sinyal ditandai dengan "BOS BULL", "BOS BEAR", "MSS BULL", atau "MSS BEAR"
- Beberapa Opsi Tampilan: Tampilkan/sembunyikan BOS atau MSS secara independen
⚡ Konfigurasi Lanjutan
- Deteksi Body/Wick: Pilih antara kriteria break hanya body atau body+wick
- Timeframe yang Dapat Disesuaikan: Analisis struktur dari timeframe lebih tinggi mana pun
- Pengaturan Swing Fleksibel: Sesuaikan sensitivitas titik pivot
- Kustomisasi Visual: Kontrol penuh atas warna, gaya garis, dan lebar
🔔 Sistem Peringatan Pintar
- Peringatan Visual: Notifikasi teks di grafik
- Peringatan Audio: Notifikasi suara opsional
- Tidak Repainting: Sinyal tetap konsisten setelah terbentuk
- Nama Peringatan Kustom: Personalisasi pesan peringatan
📈 Cara Kerja
ICT Breakers menganalisis aksi harga untuk mengidentifikasi kapan struktur pasar sedang pecah:
- BOS (Break of Structure): Terjadi saat harga memecah struktur sebelumnya searah tren, menandakan kelanjutan
- MSS (Market Structure Shift): Terjadi saat harga memecah struktur berlawanan arah tren, menandakan potensi pembalikan
Indikator ini menggunakan deteksi titik pivot canggih di berbagai timeframe untuk memberikan sinyal yang akurat dan tepat waktu yang membantu Anda:
- Menangkap kelanjutan tren lebih awal
- Mendeteksi potensi pembalikan sebelum terjadi
- Trading dengan kesadaran struktur pasar tingkat institusional
- Mengurangi sinyal palsu melalui konfirmasi multi-timeframe
🎯 Sangat Cocok Untuk
- Trader aksi harga yang mencari konsep institusional
- Pengikut metodologi ICT
- Trader yang mencari sinyal pecah struktur yang jelas
- Penggemar analisis multi-timeframe
- Mereka yang menginginkan pemantauan struktur pasar otomatis
⚙️ Pengaturan Mudah
- Tambahkan indikator ke grafik
- Atur timeframe lebih tinggi pilihan Anda untuk analisis struktur
- Sesuaikan warna dan gaya agar sesuai dengan gaya trading Anda
- Aktifkan peringatan untuk notifikasi waktu nyata
- Mulai trading dengan wawasan struktur pasar profesional
💡 Aplikasi Trading
- Mengikuti Tren: Gunakan sinyal BOS untuk masuk posisi searah tren
- Trading Pembalikan: Sinyal MSS memberi peringatan perubahan tren potensial
- Konfirmasi Breakout: Validasi trading breakout dengan analisis struktur
- Konteks Pasar: Pahami struktur pasar secara keseluruhan dengan cepat
Ini gratis sampai 31/12/2025, nikmati!!!


![Logo "[CB] Pivot Points Pro"](https://cdn.ctrader.com/image/webp/43463c82-67b0-4f10-a4ba-901bba091d81_32594)


