
Adaptive Regime Trail
Chỉ báo
Phiên bản 1.0, Nov 2025
Windows, Mac
Mô tả
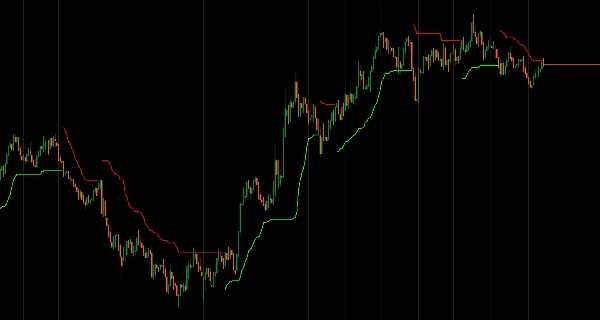
Một chỉ báo theo xu hướng thích ứng với biến động, điều chỉnh linh hoạt theo điều kiện thị trường.
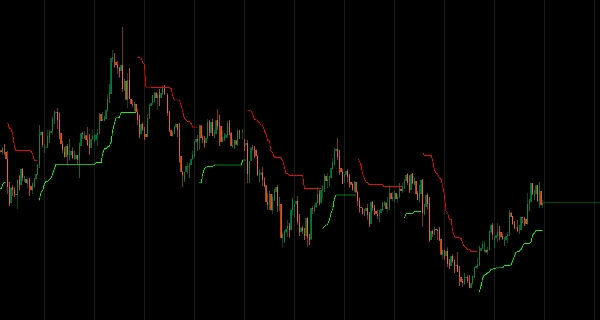
Chỉ báo này tạo ra các điểm dừng lỗ thông minh tự động thu hẹp trong thị trường yên tĩnh và mở rộng trong các giai đoạn biến động. Khác với các điểm dừng lỗ tĩnh, nó điều chỉnh khoảng cách dựa trên biến động thời gian thực, sức mạnh xu hướng và chế độ thị trường.
Các tính năng chính:
- Thích ứng biến động thông minh: Tự động điều chỉnh độ rộng đường dừng dựa trên đo lường biến động bằng ATR
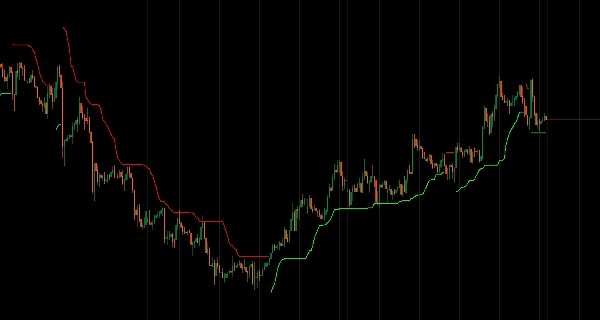
- Phát hiện chế độ: Xác định xu hướng tăng/giảm với logic xác nhận để lọc tín hiệu sai
- Bộ nhớ xu hướng: Kết hợp động lượng hướng để mở rộng đường dừng trong các xu hướng mạnh
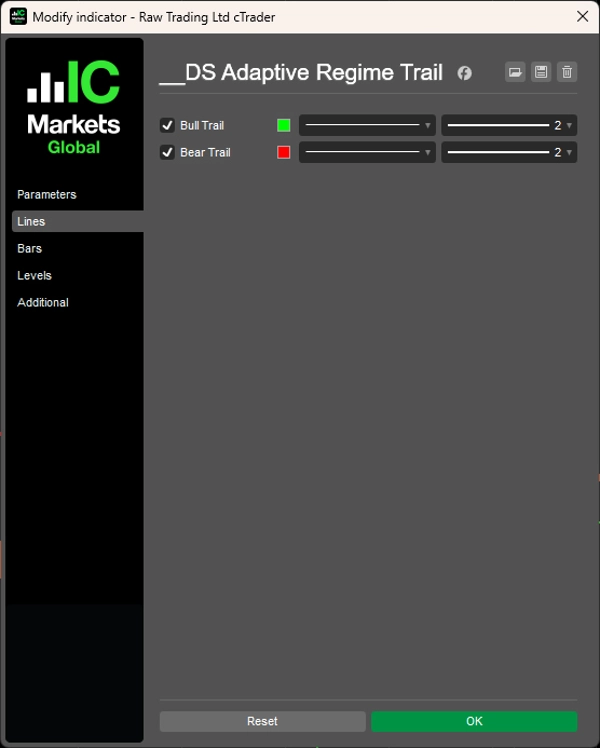
- Hiển thị trực quan rõ ràng: Chỉ hiển thị đường dừng đang hoạt động (tăng hoặc giảm), giữ cho biểu đồ gọn gàng
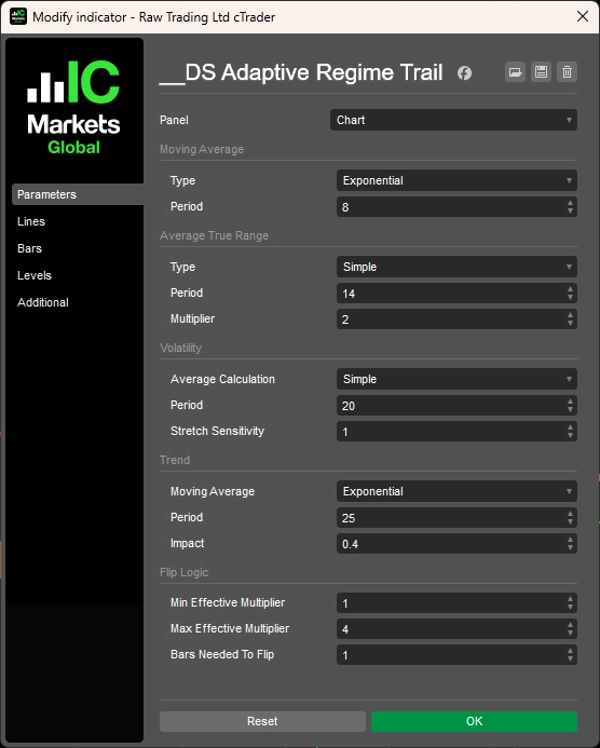
- Tùy chỉnh cao: Toàn quyền kiểm soát loại MA, độ nhạy và yêu cầu xác nhận
Cách hoạt động:
Chỉ báo kết hợp ba thành phần thích ứng:
- Kéo giãn biến động - Mở rộng đường dừng khi biến động hiện tại vượt quá mức trung bình
- Tăng cường xu hướng - Thêm không gian trong các chuyển động hướng mạnh
- Xác nhận chế độ - Yêu cầu số thanh xác định để xác nhận sự đảo chiều xu hướng, giảm thiểu tín hiệu nhiễu
Hoàn hảo cho các nhà giao dịch muốn các mức hỗ trợ/kháng cự động tôn trọng cấu trúc thị trường thay vì khoảng cách tùy ý.
Khái niệm và phương pháp gốc được điều chỉnh từ "Trend Following Volatility Trail" của HDAlgos trên TradingView.
Tóm tắt
Hồ sơ chỉ báo
Đánh giá của khách hàng
0.0
Đánh giá: 0
Đánh giá của khách hàng
Sản phẩm này chưa có đánh giá nào. Bạn đã dùng thử chưa? Hãy là người đầu tiên chia sẻ với mọi người!
Thảo luận
Câu hỏi thường gặp
Breakout
Các sản phẩm có sẵn trên cTrader Store, bao gồm bot giao dịch, chỉ báo và plugin, được cung cấp bởi các nhà phát triển bên thứ ba và chỉ nhằm mục đích cung cấp thông tin và tiếp cận kỹ thuật. cTrader Store không phải là nhà môi giới và không cung cấp lời khuyên đầu tư, khuyến nghị cá nhân hay bất kỳ đảm bảo nào về hiệu suất trong tương lai.
Sản phẩm khác của tác giả này


Giá
Kể từ 20/12/2024
8.31K
Cài đặt miễn phí