
Mô tả
📌 Xu hướng Bộ lọc Kalman – Tổng quan & Đánh giá
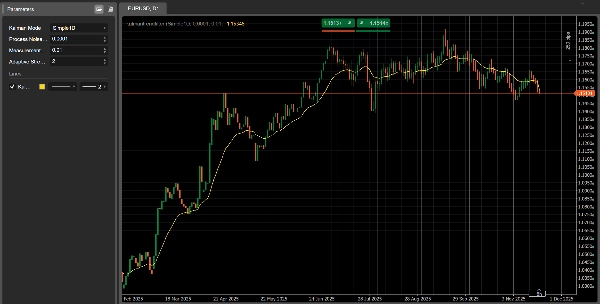
Xu hướng Bộ lọc Kalman là một chỉ báo theo xu hướng tiên tiến cho cTrader, được thiết kế để cung cấp một đường xu hướng mượt mà, phản hồi nhanh với độ trễ đáng kể thấp hơn so với các trung bình động truyền thống.
Nơi các bộ lọc SMA/EMA cổ điển phản ứng chậm và thường bỏ lỡ các thay đổi xu hướng sớm, Bộ lọc Kalman:
- Liên tục cập nhật ước tính về giá “thật”
- Cân bằng mượt mà và phản hồi một cách toán học
- Thích nghi với biến động (Chế độ thích nghi)
- Mô hình hóa cả giá và vận tốc (chế độ 2D)
Điều này làm cho nó trở thành một công cụ mạnh mẽ cho cả nhà giao dịch thủ công và nhà phát triển hệ thống tự động.
🎛 Chế độ & Tham số
Chế độ Kalman (3 Phiên bản trong Một Chỉ báo)
1️⃣ Simple1D
Bộ lọc Kalman 1D cổ điển.
Nhanh, sạch, và xuất sắc cho phát hiện xu hướng ngắn hạn.
2️⃣ PositionVelocity2D
Mô hình hóa cả giá và vận tốc xu hướng.
Lý tưởng như một bộ lọc định hướng trong các chiến lược thuật toán.
3️⃣ Adaptive1D
Tự động điều chỉnh theo biến động.
Phản ứng nhanh hơn trong thị trường nhanh, mượt mà hơn trong điều kiện yên tĩnh.
🧩 Giải thích các Tham số Chính
- Nhiễu Quá trình (Q):
Cao hơn = phản ứng xu hướng nhanh hơn, thấp hơn = đường mượt hơn. - Nhiễu Đo lường (R):
Cao hơn = bộ lọc tin tưởng dữ liệu ít hơn → kết quả mượt hơn. - Độ mạnh Thích nghi:
Chỉ dùng trong Adaptive1D. Kiểm soát mức độ biến động ảnh hưởng đến bộ lọc.
📈 Cách Diễn giải Tín hiệu
1. Phát hiện Hướng Xu hướng
- Xu hướng tăng: Đường dốc lên, giá giữ trên bộ lọc.
- Xu hướng giảm: Đường dốc xuống, giá giữ dưới bộ lọc.
- Phẳng: Thị trường đi ngang, tránh các chiến lược phá vỡ.
2. Tín hiệu Vào lệnh (Logic Giao cắt)
Vào lệnh Mua:
- Giá đóng cửa trên đường Kalman
- Đường bắt đầu quay lên
Vào lệnh Bán:
- Giá đóng cửa dưới đường Kalman
- Đường bắt đầu quay xuống
3. Độ mạnh Xu hướng (Chế độ 2D)
Độ dốc trở thành một phép đo trực tiếp của động lượng:
- Độ dốc lên mạnh → xu hướng tăng mạnh
- Độ dốc xuống mạnh → xu hướng giảm mạnh
- Độ dốc phẳng → xu hướng yếu đi hoặc giai đoạn chuyển tiếp
📊 Ví dụ Sử dụng Thực tế
✔ Chiến lược Theo xu hướng
Sử dụng Simple1D hoặc Adaptive1D:
- Mua trên đường khi độ dốc chuyển sang tích cực
- Bán dưới đường khi độ dốc chuyển sang tiêu cực
✔ Phương pháp Đa khung thời gian
- Dùng Kalman trên H1 để xác định hướng
- Dùng Kalman trên M15 để vào lệnh chính xác
- Chỉ vào lệnh theo hướng được khung thời gian cao hơn chỉ ra
✔ Tích hợp Bot
Hoàn hảo cho giao dịch thuật toán:
- Cho phép chỉ mua dài nếu độ dốc > 0
- Cho phép chỉ bán ngắn nếu độ dốc < 0
- Sử dụng Adaptive1D cho các chỉ số biến động như US500, NAS100, US2000
🌟 Tham gia Cộng đồng của Chúng tôi
Nếu bạn muốn truy cập vào:
- Các tối ưu hóa độc quyền cho từng bot của chúng tôi
- Mẹo cấu hình nâng cao
- Cải tiến giao dịch
- Hỗ trợ kỹ thuật cá nhân hóa
- Cập nhật và công cụ mới
👉 Tham gia cộng đồng của chúng tôi bằng cách nhấp vào liên kết trên trang hồ sơ của tôi.
Ở đó bạn sẽ tìm thấy các cài đặt tối ưu hóa tốt nhất cho tất cả các bot của chúng tôi, được cập nhật thường xuyên.
Tóm tắt
Đánh giá của khách hàng
5 | 0 % | |
4 | 100 % | |
3 | 0 % | |
2 | 0 % | |
1 | 0 % |


![Logo "[Stellar Strategies] Market Session Ultimate"](https://cdn.ctrader.com/image/webp/61ffd537-0125-4246-9e72-42eca1791d64_28232)


