Mô tả
Lợi Thế Trọng Số Khối Lượng: Lộ Trình Hoàn Chỉnh Cho Đà cTrader
Các chỉ báo tiêu chuẩn cho bạn biết giá đã đi đến đâu. Chỉ báo Nến RSI Trọng Số Khối Lượng cho bạn thấy sự thuyết phục đằng sau chuyển động. Bằng cách kết hợp hành động giá, khối lượng tick và năm mức quan trọng của tổ chức, công cụ này biến RSI từ một bộ dao động đơn giản thành một hệ thống bản đồ xu hướng toàn diện.
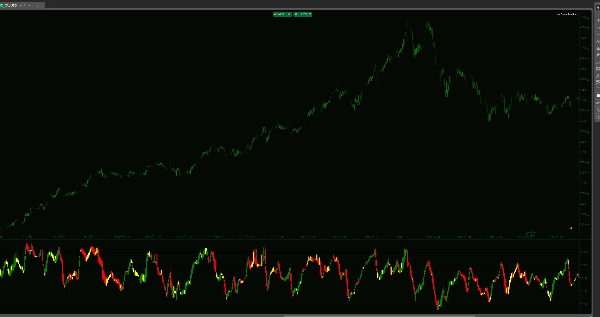
Thay vì một đường đơn, bạn nhận được nến OHLC đầy đủ trong cửa sổ chỉ báo của mình. Điều này cho phép bạn nhìn thấy "cấu trúc" của đà—tiết lộ liệu một chuyển động có được hỗ trợ bởi khối lượng tổ chức lớn hay chỉ là một "giả mạo" thanh khoản thấp.
Chiến Lược Thực Thi 5 Vùng
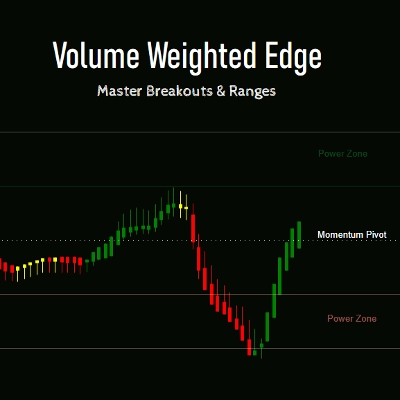
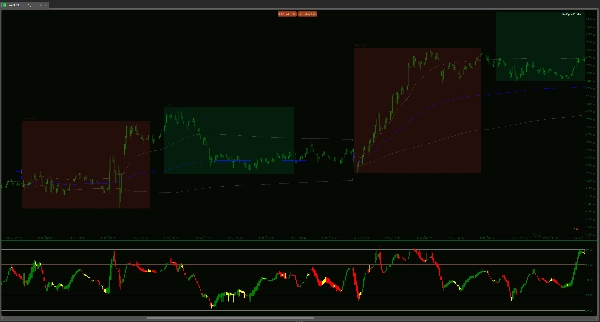
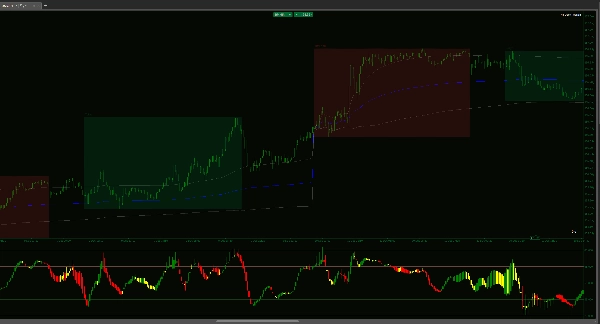
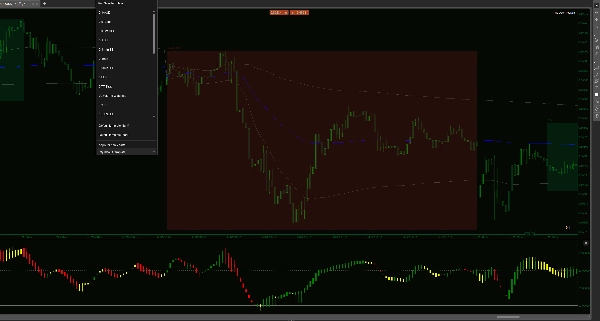
- Mở Rộng Sức Mạnh (65–80 & 20–35): Đây là các vùng có độ thuyết phục cao. Khi các nến trọng số khối lượng duy trì ở đây, bạn không tìm kiếm sự đảo chiều—bạn đang đi theo xu hướng. Đây là nơi tiền lớn hoạt động, và nơi xảy ra những chuyển động bùng nổ nhất.
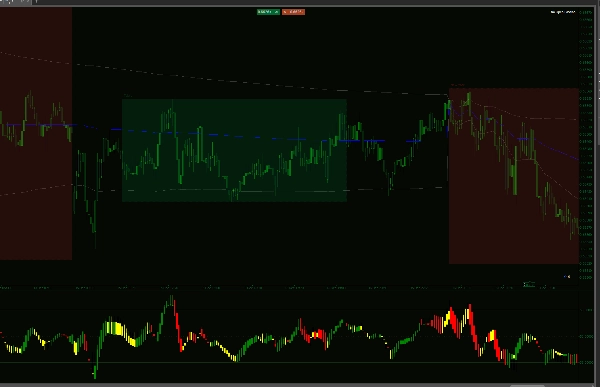
- Hành Lang Scalping (50–65 & 35–50): Hoàn hảo cho phiên châu Á hoặc thị trường trong biên độ. Khi xu hướng khung thời gian cao hơn là trung tính, các vùng này cung cấp các mục tiêu "quay về trung bình" có xác suất cao. Nếu thị trường đang trong biên độ, các hành lang này cho phép bạn scalping các vòng quay với độ chính xác như phẫu thuật.
- Điểm Quay Đà (50): Đường ranh giới tối thượng. Một thân nến trọng số khối lượng đóng cửa vượt qua mức này là cảnh báo đầu tiên về sự thay đổi cấu trúc trong kiểm soát thị trường.
Tại Sao Công Cụ Này Thay Đổi Quy Trình Làm Việc Của Bạn
Độ Rõ Ràng Trọng Số Khối Lượng: Mỗi nến được tính bằng cách nhân sự thay đổi giá với khối lượng tick. Nếu một chuyển động xảy ra trên khối lượng thấp, nến RSI sẽ không xác nhận nó. Điều này giúp bạn tránh khỏi các chuyển động "bẫy" trông đẹp trên biểu đồ giá nhưng không có sự hỗ trợ.
Thông Tin Thân Nến: Các đường RSI truyền thống thường dao động và gập ghềnh. Các nến làm mượt bằng WMA của chúng tôi cho bạn thấy "mở" và "đóng" của đà. Nếu thân nến RSI dày và chắc, xu hướng là khỏe mạnh. Nếu các bóng nến dài, đà đã cạn kiệt.
Đa Dạng Thị Trường: * Xu hướng: Sử dụng phạm vi 65–80 để giữ các giao dịch thắng lâu hơn.
Trong biên độ/Scalping: Sử dụng các hành lang 35–65 để bắt các vòng quay nhanh trong các phiên có biến động thấp như châu Á.
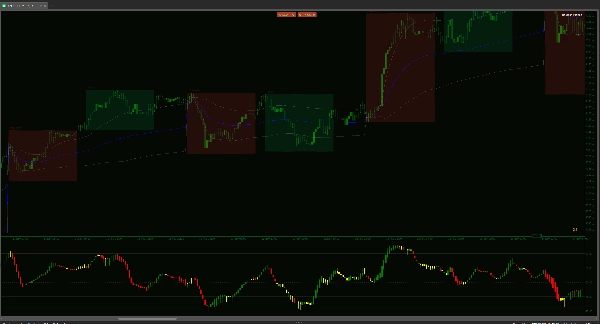
Tránh Bẫy "Mã Vạch": Hầu hết các chỉ báo buộc bạn phải đoán trong các giai đoạn biến động thấp. Chỉ báo này có hiệu ứng "Mã Vạch" trực quan độc đáo trong giai đoạn tích lũy. Khi các nến co lại, phẳng và trở nên trung tính, chỉ báo đang báo hiệu rằng "động cơ thị trường" đã tắt. Cảnh báo trực quan này giúp bạn tránh vào các giả mạo khối lượng thấp và bị "xé nhỏ" khi không có tiền thật đằng sau chuyển động giá.
Tối Ưu Hóa Cho cTrader Bản Địa: Được xây dựng riêng cho API C# với logic "Max Visual Candles" để đảm bảo nền tảng của bạn vẫn phản hồi nhanh, ngay cả trên biểu đồ 1 phút.
Ngừng giao dịch dựa trên nơi thị trường có thể đi. Bắt đầu giao dịch dựa trên nơi khối lượng thực sự đang đẩy nó. Chỉ báo này không chỉ về các tín hiệu—mà còn về việc hiểu năng lượng nội tại của thị trường.
Tóm tắt
Đánh giá của khách hàng
5 | 33 % | |
4 | 67 % | |
3 | 0 % | |
2 | 0 % | |
1 | 0 % |


