present
Đăng ký và nhận ưu đãi $50 cho lần mua đầu tiên
Trading product for MidasVolumeProfile Chỉ báo Key Levels Volume, image 1
MidasVolumeProfile
Chỉ báo
Phiên bản 1.3, Oct 2026
Windows, Mac
Trading product for MidasVolumeProfile Chỉ báo Key Levels Volume, image 2
Trading product for MidasVolumeProfile Chỉ báo Key Levels Volume, image 3
Trading product for MidasVolumeProfile Chỉ báo Key Levels Volume, image 4
Kể từ 27/09/2026

Mô tả

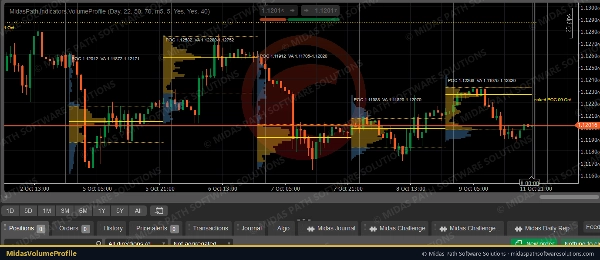
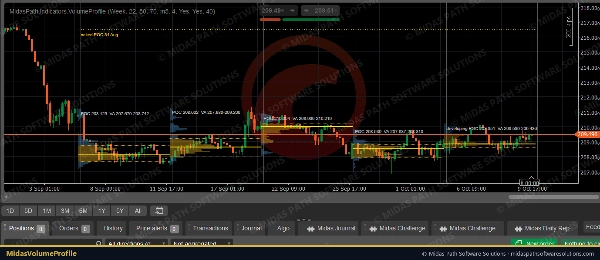
Midas Volume Profile shows where volume traded in each day or week, drawn as a histogram at the start of the session, with the levels profile traders use.


What it shows

• A volume histogram for each session, with the value area highlighted.

• POC (point of control): the price row with the most volume, drawn across the session.

• Value area high and low (VAH / VAL): the range around the POC that holds 70% of the session's volume (adjustable).

• Naked POCs: earlier sessions' POCs that price has not traded through since, extended to the right until price touches them.

• The developing profile of the current session, updated as each candle closes.


How it is built

• Volume is cTrader's tick volume (the number of price updates), the usual measure in forex and CFDs, where there is no central exchange volume. It is taken from a lower timeframe (5 minutes by default) for detail.

• Each candle's volume is shared across the price rows its high-low range covers, in proportion to the overlap. The session's range is split into 50 rows (adjustable).

• The value area grows from the POC towards whichever neighbouring row holds more volume, until it holds the chosen share.


Settings

• Profiles per day or per week, session start hour (22:00 UTC by default, the forex day), rows, value-area share, volume timeframe.

• Number of sessions shown, developing session on or off, naked POCs on or off, histogram width and colours.


Tested

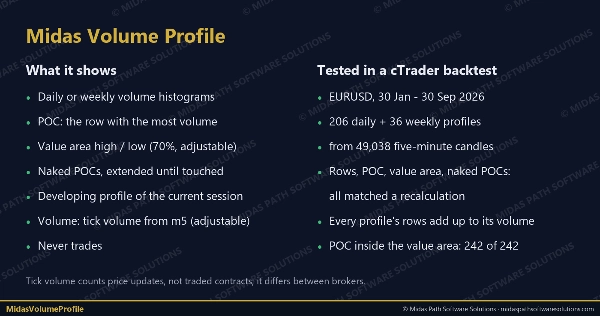
• In a cTrader backtest on EURUSD (30 Jan-30 Sep 2026), all 206 daily and 36 weekly profiles built from 49,038 five-minute candles matched an independent recalculation: session boundaries, every row's volume (each profile's rows add up to its total volume), POC, value area and every naked-POC touch.

• On that data the POC sat inside the value area in every profile, the value area held 71% of volume on average (rows are whole, so it slightly exceeds 70%), and 10 daily and 2 weekly POCs were still naked at the end.


Notes

• Tick volume counts price changes, not traded contracts; it differs between brokers.

• Volume profiles describe where trading happened; they do not predict where price will go.

• It never trades and needs no internet or file access.

Tóm tắt

Tóm tắt AI
Midas Volume Profile is an indicator that visualizes session volume distribution using tick volume data, primarily for forex and CFD markets where centralized volume is unavailable. It displays a histogram of traded volume for each day or week at the session start, highlighting key levels used by volume profile traders.

Key features include:
- Point of Control (POC): the price level with the highest traded volume, extended across the session.
- Value Area High and Low (VAH/VAL): price range around the POC containing approximately 70% of the session’s volume, adjustable by the user.
- Naked POCs: POCs from previous sessions that price has not revisited, extended until touched.
- A developing profile for the current session, updated with each candle close.

The indicator calculates volume by distributing each candle’s tick volume proportionally across price rows within its high-low range, dividing the session range into adjustable rows (default 50). It supports profiles per day or week, customizable session start times, and visual settings such as histogram width and colors.

Midas Volume Profile operates without trading or internet access and has been tested for accuracy against independent recalculations on EURUSD data. It provides a detailed view of where trading activity concentrates but does not predict price direction.
Hồ sơ chỉ báo
Danh mục chỉ báo
Khối lượng
Loại đầu ra
Hình ảnh trực quan
Yêu cầu dữ liệu
Chỉ dữ liệu nến

Thảo luận

Đánh giá của khách hàng

0.0
Đánh giá: 0
Đánh giá của khách hàng
Sản phẩm này chưa có đánh giá nào. Bạn đã dùng thử chưa? Hãy là người đầu tiên chia sẻ với mọi người!

Câu hỏi thường gặp

Key Levels
Volume
Support & Resistance
Các sản phẩm có sẵn trên cTrader Store, bao gồm bot giao dịch, chỉ báo và plugin, được cung cấp bởi các nhà phát triển bên thứ ba và chỉ nhằm mục đích cung cấp thông tin và tiếp cận kỹ thuật. cTrader Store không phải là nhà môi giới và không cung cấp lời khuyên đầu tư, khuyến nghị cá nhân hay bất kỳ đảm bảo nào về hiệu suất trong tương lai.

Sản phẩm khác của tác giả này
Plugin cho máy tính
File Access
Trade Journal
Your watchlist in one grid: trend on five timeframes, ADR used, correlation to the chart's symbol, currency strength.
Chỉ báo
Key Levels
Liquidity Grab
+2
The levels you mark each morning, drawn and followed: PDH/PDL, weekly, monthly, sessions, equal highs/lows.
cBot
Partial Close
Prop Firm Fit
Copies opens, closes, partial closes and SL/TP from one cTrader account to others on the same PC, with safe sizing.
Plugin cho máy tính
External Data
Study economic event reactions with broker M1 history, bar replay, range comparisons and a reproducible export.

Bạn cũng có thể thích

Chỉ báo
ATR
BOS
+5
Market structure with BOS and CHoCH, order blocks, and retest buy/sell arrows with entry, stop and two targets
Chỉ báo
VWAP
Volume
+5
Multi VWAP. Three timeframes. One clean chart. Your Essential Trading Tool.
Chỉ báo
Forex
BTCUSD
+5
Multi-timeframe moving averages with session lines for structured trend analysis directly on the chart.
Chỉ báo
ATR
MSS
+5
Advanced market structure and institutional cycle mapper with visual reference cards and entry alerts
Chỉ báo
Pin Bar
Inducement
+5
Institutional Nasdaq Session Liquidity Map with Live Point HUD, Sweep Alerts & Interactive Playbook.
Chỉ báo
Forex
Crypto
+5
ICT Order Block Advanced
Chỉ báo
Supertrend
Moving Average
Easy Trade: Trend & Breakout Indicator for cTrader
Logo "SSL Channel"
Phổ biến
4.5
(4)
$19
/
$20
Chỉ báo
Forex
BTCUSD
+10
Trend-following channel using dual MAs with visual cloud and optional alerts on crossovers
Chỉ báo
AI
ATR
+20
Detects smart money activity using advanced tick volume and price divergence analysis.
Chỉ báo
Pin Bar
Inside Bar
+2
Advanced candlestick pattern recognition with structural quality scoring, alerts and adaptive chart visuals.
Chỉ báo
Master RSI reversals with Parabolic SAR precision! Get real-time alerts for high-probability trend changes.
Chỉ báo
Imbalance
Inside Bar
+3
A clean and powerful Smart Money Concepts tool combining Fair Value Gaps, Previous Daily High/Low, Inside/Outside bar
Chỉ báo
The Break of Structure (BoSCHoCh) Indicator is a smart market structure tool designed to help traders easily spot trend.
Logo "LT_SmartSwings"
Phổ biến
5.0
(2)
$19
/
$25
Chỉ báo
ATR
Breakout
Detects swing highs/lows, structure, breakouts, trend lines, and fibs — great for price action trading.
Logo "ORB v1"
Phổ biến
5.0
(3)
$19
Chỉ báo
Breakout
Opening Range Breakout (ORB) - Visual Edition
Chỉ báo
AI
ATR
+26
SMC without the mess: Clean structure + auto-managing FVGs + MTF panel. Hard-right-edge, step size-based for any symbol.
Chỉ báo
Forex
Alerts you when price touches Fibonacci levels. Stay organized and trade efficiently!
Chỉ báo
VWAP
Volume
+4
Volume Profile + VWAP with Standard Deviations

Giá

Kể từ 27/09/2026