说明
趋势熵 – 免费 cTrader 指标
熵是系统中无序或不确定性的科学度量。在物理学中,它显示了能量如何分散以及系统为何趋向混乱。在信息理论中,它衡量数据的不可预测性。低熵意味着有序和可预测,而高熵反映了随机性、复杂性和结果清晰度的降低。
发现混乱中的秩序力量。趋势熵是一种前沿技术指标,旨在衡量价格走势的组织性与随机性。不同于仅跟踪动量或波动性的传统振荡器,趋势熵应用先进的熵计算,揭示市场是以结构化方式趋势移动,还是漂移进入混沌区间行为。
这个免费工具为希望深入了解价格行为隐藏动态的交易者而设计。通过将统计熵与 RSI 风格的平滑和自适应阈值相结合,趋势熵将原始波动性转化为从 0% 到 100% 的清晰归一化刻度。结果是一条优雅的单线,告诉您市场处于强趋势、中性盘整还是波动区间。
如何解读趋势熵
低值(0–33%):市场有序。如果平均收益为正,表明可能的上涨趋势;如果为负,则表示可能的下跌趋势。
中值(34–66%):中性区域。市场可能处于盘整状态,依据平均收益略偏多头或空头。
高值(67–100%):混乱占主导。价格走势区间震荡,不可预测,对趋势跟随策略的可靠性较低。
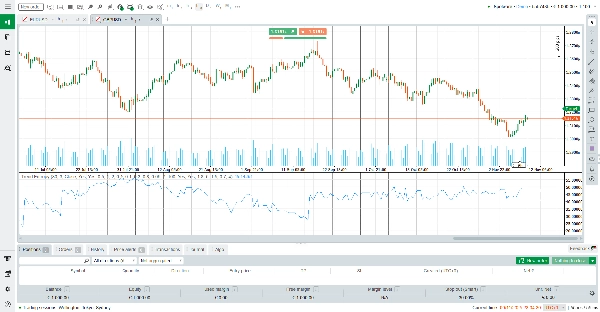
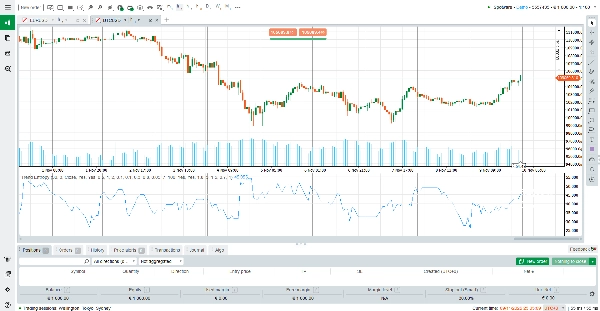
在 25%、50% 和 75% 处的水平参考线使解读简单。交易者可以立即看到熵是趋向有序的压缩还是向混乱的扩展。
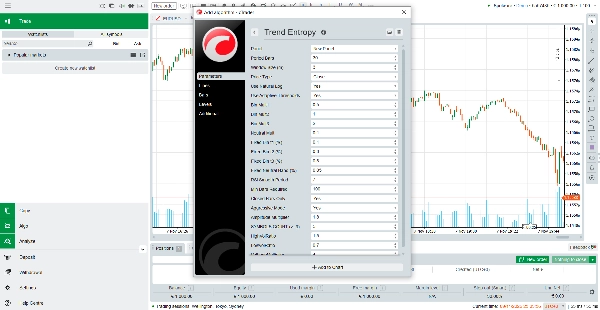
指标工作原理
趋势熵计算选定周期内的收益,并将其映射为符号状态。这些状态在重叠窗口中分析,以构建价格模式的频率分布。利用熵数学,指标测量这些序列中的无序程度。
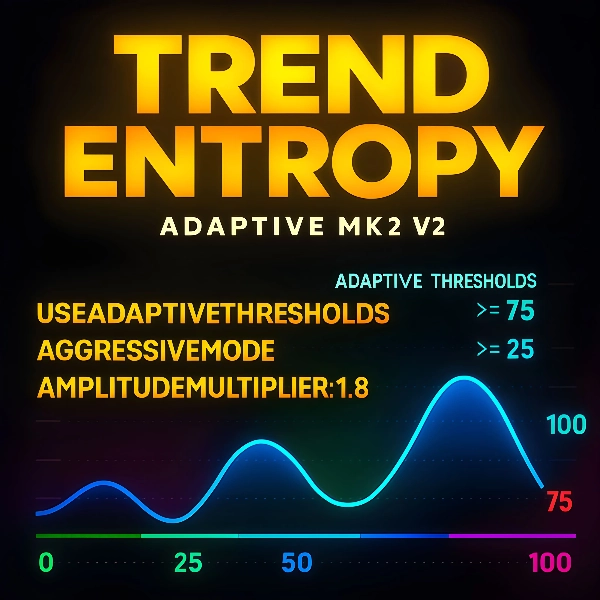
为了使输出实用,原始熵被归一化为百分比刻度,然后使用 Wilder 风格的平均方法进行平滑。自适应阈值确保指标适应当前波动性,而激进模式则放大信号,适合偏好更敏锐反应的交易者。最后,应用波动率比率来优化读数,在混乱条件下推高数值,在稳定条件下降低数值。
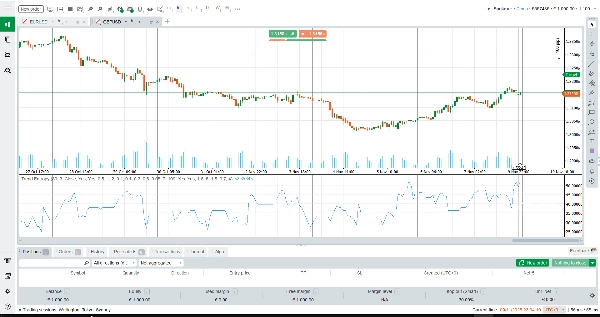
最终结果是一条平滑的单线,捕捉市场结构的本质:价格是有序趋势还是漂移进入随机状态。
主要特点
基于熵的分析 – 超越动量,衡量价格行为的真实组织性。
自适应阈值 – 自动调整波动性,保持信号在所有市场条件下的相关性。
RSI 风格平滑 – 提供干净、稳定的线条,避免噪声波动。
波动率整合 – 通过比较短期和长期波动率比率提升准确性。
清晰的视觉设计 – 水平参考线和单一 DodgerBlue 线使解读轻松。
为何选择趋势熵?
趋势熵不仅仅是另一个振荡器。它是一种结合统计严谨性与交易者友好可视化的混合工具。无论您是寻求确认的趋势跟随者,还是希望避开混乱市场的区间交易者,这个指标都能为您提供所需的清晰度。
摘要
The indicator outputs a single smoothed line on a normalized scale from 0% to 100%, where low values (0–33%) indicate organized trending markets, mid values (34–66%) suggest neutral or consolidating conditions, and high values (67–100%) reflect chaotic, ranging markets. Horizontal reference lines at 25%, 50%, and 75% aid interpretation.
Trend Entropy pro incorporates RSI-style smoothing, adaptive thresholds that adjust to current volatility, and volatility ratio integration to enhance signal accuracy. It is designed to provide traders with deeper insight into market dynamics beyond traditional momentum or volatility indicators, supporting analysis across various markets including Forex, cryptocurrencies, commodities, indices, and stocks.
This indicator is suitable for traders seeking to identify trending versus ranging conditions and improve decision-making in trend-following or range-trading strategies.