

说明
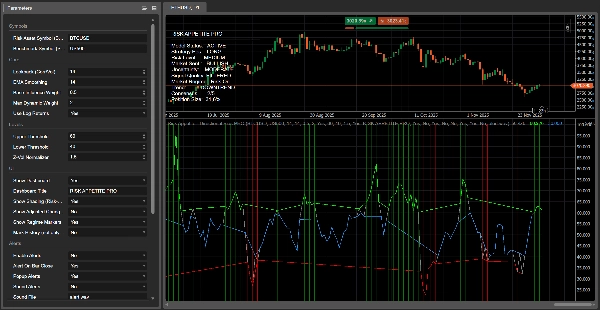
🚀 风险偏好与方向性偏差 ULTRA(cTrader) 是一个专业的市场状态指标,旨在衡量 风险偏好 / 中性 / 风险规避 状态,并将其转化为清晰、可操作的 方向性偏差。它不是依赖单一市场,而是比较 两个工具(“风险代理”和“基准”)来构建实时 风险评分(0–100),突出状态转换,并通过图表上的 仪表盘显示 汇总所有信息。
🔧 前两个参数的含义(及其重要性)
🟠 风险资产符号(BTC)
这是 风险代理——用作“风险偏好温度计”的工具。它标记为“BTC”,因为最初的概念使用比特币作为全球风险偏好代理,但 你并不一定要使用比特币。你可以设置为任何能很好代表风险情绪的资产(例如,BTC、纳斯达克/US100、高贝塔指数等)。
🔵 基准符号(SP/US500)
这是你想跟踪宏观偏差的 参考市场(基准)。通常是 US500/SPX500,但也可以是你认为的主要“背景驱动”工具。
✅ 简而言之:
- 风险资产 = 情绪传感器(风险偏好来源)
- 基准 = 你希望偏差反映的参考市场
❓ 我必须用比特币吗?
不。你可以根据目标以不同方式使用该指标:
✅ A) 宏观“经典”风险偏好/风险规避(推荐)
- 风险资产: BTCUSD
- 基准: US500 / SPX500
这提供了全球风险状态的清晰视图。
✅ B) 带宏观背景的比特币交易
- 风险资产: BTCUSD
- 基准: US500(或其他宏观参考)
这帮助你理解宏观条件何时支持或反对BTC。
✅ C) 多资产/自定义市场关系
- 风险资产:BTC 或 US100
- 基准:你想过滤的市场(GER40、XAUUSD 等)
这使指标成为灵活的“情绪引擎”。
⚙️ 工作原理(核心逻辑)
模型对两个符号计算以下内容:
📈 收益率(%)(可选对数以提高稳定性)
📊 波动率(所选回溯期的标准差)
🔗 滚动相关性,两组收益率序列之间
🎛️ 动态权重,根据以下因素调整风险代理的影响力:
- 相关性强度
- 相对波动率
这产生了一个 调整后的变化 信号,具体为:
- EMA平滑
- 归一化为 0–100 风险评分
📊 如何解读(最重要的信号)
🎯 风险评分(0–100) 是你的主要指南针:
🟢 风险偏好(评分高于上限阈值,例如 > 60)
→ 风险偏好强烈,环境通常有利于动量/风险资产
🔵 中性(介于下限和上限阈值之间,例如 40–60)
→ 过渡/震荡/信号混合,建议过滤
🔴 风险规避(评分低于下限阈值,例如 < 40)
→ 防御性环境,谨慎性提高,下行风险通常较高
🔴 红线“断裂”的原因(及其含义)
在此 ULTRA 版本中,视觉效果是有意的且基于“状态”:
- 一个 连续基线(灰色)始终可见
- 彩色覆盖仅在其对应状态下出现:
-
- 红色覆盖仅在 风险规避 时出现
- 绿色覆盖仅在 风险偏好 时出现
- 蓝色覆盖在 中性 时出现
因此,当市场离开风险规避并进入中性(或风险偏好)时,红色覆盖变为 空白(NaN),cTrader 停止绘制它——这就是它看起来像“中断”的原因。✅
📌 重要提示:这 并不自动 意味着看跌趋势“结束”了。
它意味着模型不再检测到 强烈、确认的风险规避状态,因此看跌优势减弱,市场可能处于 过渡期。
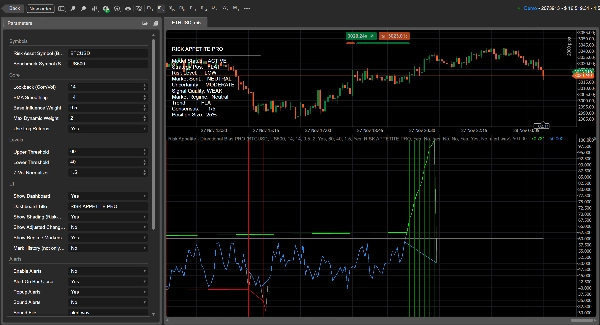
🖥️ 图表上的显示(仪表盘)用途——逐行解释
仪表盘是你的 实时决策面板。它总结了状态、置信度和战术指导,因此你不必仅凭曲线猜测。
✅ 模型状态
显示模型是否正常运行。
- ACTIVE = 有效数据可用且计算正确
- NO DATA = 缺少符号数据、符号名称错误或历史/时间未对齐
🎯 策略仓位(Strategy Position)
基于状态的建议立场:
- 多头 = 风险偏好
- 空头 = 风险规避
- 观望 = 中性
⚠️ 风险等级
基于市场波动性和不确定性的风险强度度量。
- 非常低 / 低 = 条件更稳定
- 中等 = 正常
- 高 / 非常高 = 噪音更大,鞭打风险更高;建议减少仓位或要求更强确认
🧠 市场情绪
基于评分水平的方向性基调:
- 看涨 / 看跌 / 中性
🌫️ 不确定性
显示模型的“清晰度”。当以下情况发生时增加:
- 相关性减弱,或
- 波动率上升(环境更不稳定)
等级: 低 / 中等 / 高
🧪 信号质量
基于以下内容的综合评级:
- 信号强度(与50的距离)
- 不确定性水平
输出: 强 / 过滤 / 弱
🔥 市场状态
主要分类:
- 风险偏好 / 中性 / 风险规避
这是驱动颜色覆盖、阴影和仓位偏差的核心状态。
📉 趋势
评分的短期方向(斜率):
- 上升趋势 = 风险偏好上升
- 下降趋势 = 风险偏好下降
- 持平 = 横盘/低动量
🗳️ 共识(X/5)
一个简单的对齐评分,计算多少关键条件达成一致(方向、斜率、相关性对齐等)。
数值越高 = 环境越清晰、一致。
📏 仓位大小
基于信号强度和不确定性的建议持仓比例:
- 强且不确定性低 → 建议较大仓位
- 弱或不确定 → 建议较小仓位
🧭 多时间框架优势(实践中非常强大)
当你分析同一市场的 多个时间框架 时,指标会根据时间框架更新和重新对齐。这使得识别以下情况变得容易:
✅ 时间框架对齐(信号更强)
✅ 时间框架冲突(通常为更中性/震荡的条件)
较高时间框架定义 宏观状态,较低时间框架帮助 时机选择。
📌 标记、警报与通知(ULTRA 功能)
✨ 状态标记 在状态变化时显示在图表上:
- 风险偏好 ↔ 中性 ↔ 风险规避
这使得转换瞬间可见。
🔔 警报与通知 可启用,以便你收到:
- 弹出警报(可选声音)
- K线收盘警报(推荐,避免蜡烛形成时的误触发)
💬 加入我们的(优化 + 预设 + 工具)
想要获得此指标的最佳表现?加入我们的 Discord,享受:
✅ 为你的经纪商符号进行参数优化
✅ 即用型预设(加密货币 / 指数 / 外汇)
✅ 多时间框架设置指导
✅ 提升信号过滤和执行质量的高级工具和更新
摘要
客户评价
5 | 100 % | |
4 | 0 % | |
3 | 0 % | |
2 | 0 % | |
1 | 0 % |


