
说明
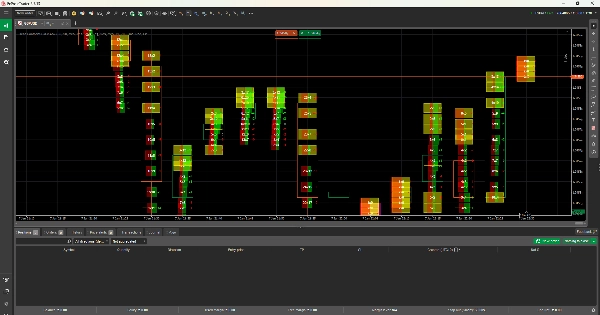
cTrader 专业足迹图和Delta指标
此cTrader足迹图指标读取 真实的逐笔数据,展示买卖双方在每个价格水平的互动。它显示 成交量、买卖差额和不平衡,帮助交易者清晰地看到谁在控制市场。
基于 市场轮廓和成交量轮廓概念构建,该指标突出显示高活动区域、价值区和强支撑或阻力。交易者无需仅凭价格猜测,可以基于 真实成交量和订单流做出决策。
非常适合剥头皮和日内交易,该工具通过揭示价格变动背后的真实情况,为cTrader用户提供专业优势。
该指标帮助您了解 每根K线内真实发生的情况。它读取逐笔数据,显示每个价格点买卖双方的成交量。
您可以清楚地看到:
- 买方更强的位置
- 卖方更强的位置
- 动能增强或减弱的时刻
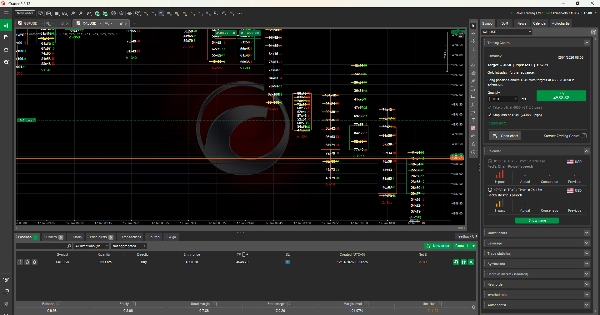
该指标还显示 Delta,即买卖压力的差异。它基于 市场轮廓和成交量轮廓构建,因此您可以轻松识别市场反应的重要价格区域。
这使得初学者交易更简单,因为您无需猜测。您可以看到 真实成交量和真实市场活动,而不仅仅是基于价格的指标。
摘要
指标配置
客户评价
0.0
评价:0
客户评价
该产品尚无评价。已经试过了?抢先告诉其他人!
讨论
常见问答
BTCUSD
Forex
Signal
Breakout
Indices
EURUSD
Commodities
GBPUSD
NZDUSD
Martingale
Scalping
Supertrend
Fair Value Gap
SMC
Crypto
Grid
Stocks
AI
XAUUSD
NAS100
USDJPY
cTrader Store 提供的所有产品,包括交易机器人、指标和插件,均由第三方开发者提供,仅供信息参考和技术访问之用。cTrader Store 并非经纪商,不提供投资建议、个人推荐或任何未来业绩保证。
该作者的其他作品


!["Wyckoff Toolkit [Iridio Capital]" 标识](https://cdn.ctrader.com/image/webp/8acfe6a1-6a8e-4578-9367-9df3af2b1801_27763)


价格
注册日期 15/01/2025
7
销售