
Описание
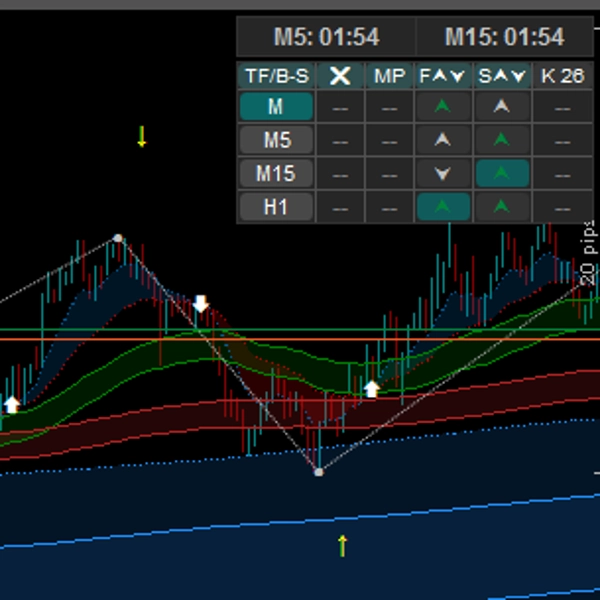
Ultimate MTF Trend & Momentum Dashboard — это продвинутый аналитический набор, созданный для устранения «загромождения графиков» и предоставления институционального контекста рынка. Объединяя критически важные данные с нескольких таймфреймов в стильной интерактивной панели на графике, он позволяет принимать торговые решения быстрее и с большей уверенностью. Независимо от того, являетесь ли вы скальпером на низких таймфреймах или дневным свинг-трейдером, этот инструмент предоставляет точные данные о силе тренда, потенциальных откатах и ключевых структурных уровнях. Индикатор предназначен для входа в полуавтоматические сделки вручную или с помощью бота https://ctrader.com/products/3618
Есть ли возможность отображать таймфрейм и любые комбинации таймфреймов для показанных средних — отличные от текущего таймфрейма в cTrader?
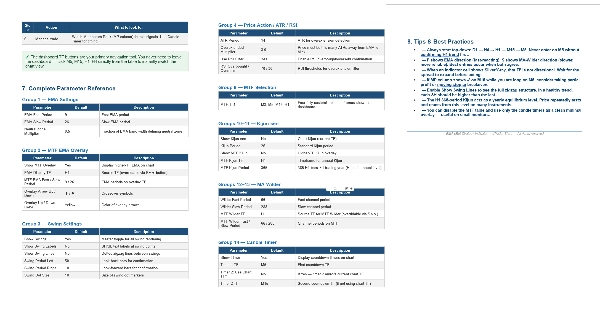
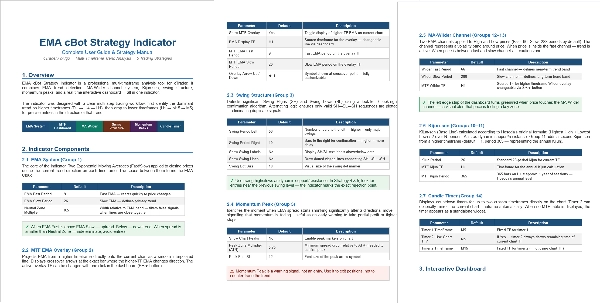
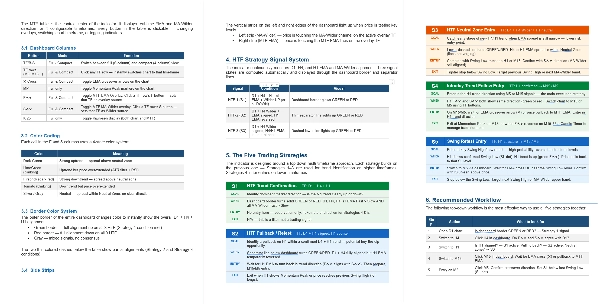
Руководство - https://clogic-algo.github.io/EMA_cBot_Strategy_Guide/EMA_Strategy_Guide.html
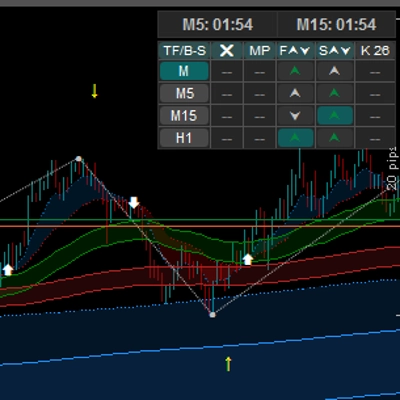
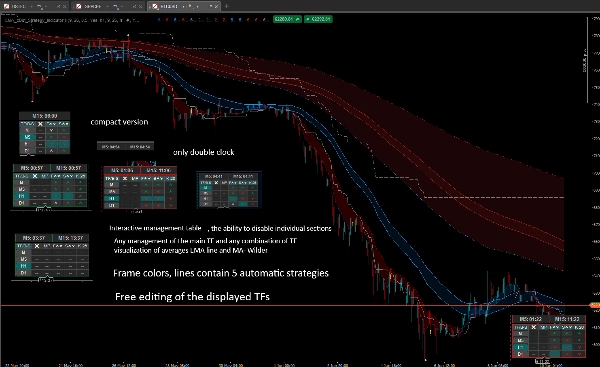
1. Интерактивная панель Multi-Timeframe (MTF)
- Мониторинг до 4 таймфреймов (например, M1, M5, H1, D1) одновременно в чистой панели пользовательского интерфейса.
- Кликабельный интерфейс: мгновенно меняйте таймфрейм графика, просто нажимая кнопки на панели!
- Компактный / Полный режимы: переключайте размер панели, чтобы показывать или скрывать расширенные метрики (EMA, Wilder, Kijun и сигналы Momentum) для экономии места на экране.
- Граница выравнивания HTF: граница панели динамически меняет цвет, чтобы предупредить вас, когда старшие таймфреймы (H1, H4, D1) полностью совпадают.
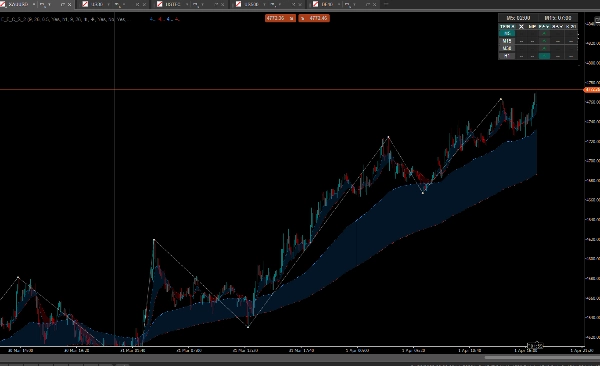
2. Автоматическая структура рынка (Swing High / Swing Low)
- Автоматически определяет и отмечает точки разворота (Swing Highs / Lows) визуальными точками и текстовыми метками.
- Опционально рисует Swing Lines (в стиле Зиг-Заг) для легкой визуализации волн рынка и пробоев структуры рынка.
- Полный контроль над чувствительностью swing (регулируемые периоды просмотра слева/справа).
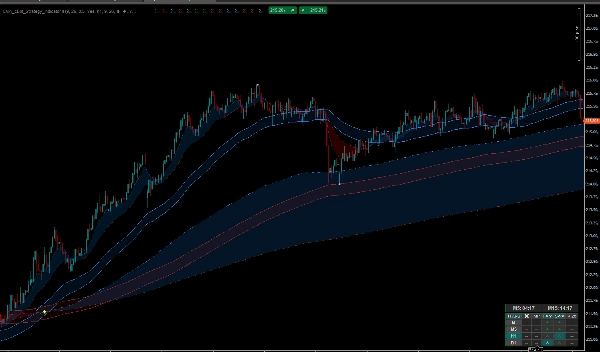
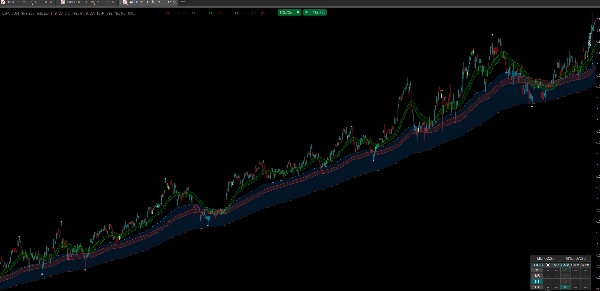
3. Продвинутые скользящие средние и трендовые облака
- Визуализируйте направление тренда с помощью прозрачных «облаков», построенных между быстрыми и медленными скользящими средними (EMA и MA-Wilder).
- Настоящие MTF наложения: плавно и без искажений наносите EMA старших таймфреймов (например, 1-часовой EMA) прямо на текущий график с более низким таймфреймом (например, 5-минутный).
- Встроенные визуальные стрелки и оповещения для пересечений EMA.
4. Истощение тренда и пики импульса
- Использует умный алгоритм в сочетании с фильтрами ATR и RSI для обнаружения сильного перекупленности цены.
- Пики импульса: индикатор анализирует «расстояние» между быстрыми и медленными средними. Когда сильный импульс заканчивается и средние начинают сжиматься, он выводит специальную стрелку предупреждения «Пик» — отличный инструмент для обнаружения откатов и зон фиксации прибыли.
5. Поддержка Ichimoku (Kijun-sen)
- Включайте классическую линию Kijun-sen, которая действует как динамическая поддержка/сопротивление.
- Включает опцию MTF Kijun для отображения базовой линии с более высокого таймфрейма на вашем текущем графике.
6. Полосы состояния Edge и двойной таймер свечей
- Незаметные, цветовые «Edge Strips» (тире) рядом с панелью дают мгновенное визуальное представление о трендовом уклоне старших таймфреймов, гарантируя, что вы не торгуете против макротренда.
- Встроенный двойной обратный отсчет, показывающий оставшееся время для текущей свечи И свечи старшего таймфрейма (например, M5 и H1) одновременно.
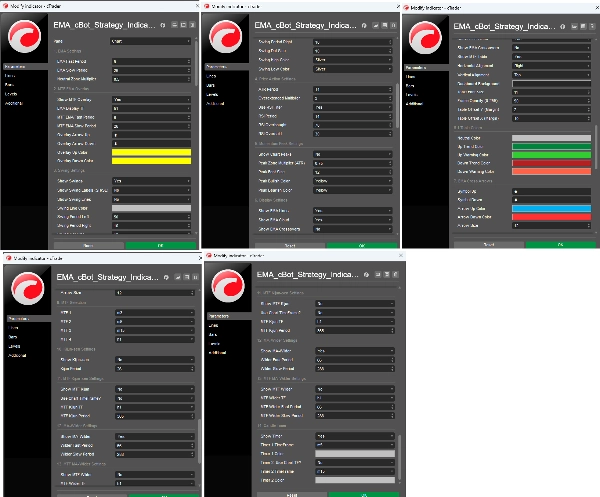
⚙️ Максимальная настройка:
Этот индикатор создан для адаптации к вашей стратегии. У вас полный контроль над:
- Периодами и параметрами всех скользящих средних (EMA, Wilder, Kijun).
- Полной настройкой цветов интерфейса (облака, фон панели, текст, предупреждения тренда).
- Позиционированием панели (слева/справа, сверху/снизу), отступами и прозрачностью.
- Порогами фильтров ATR и RSI для устранения ложных сигналов.
Для кого этот индикатор?
- Последователи тренда, стремящиеся согласовать свои входы с импульсом старших таймфреймов.
- Трейдеры Price Action, которые полагаются на точную структуру рынка Swing High/Low.
- Дейтрейдеры и скальперы, которым нужен постоянный обзор трендов H1/H4/D1 без загромождения рабочего пространства множеством окон.
Оптимизируйте пространство экрана и получите огромное преимущество с настоящим контекстом Multi-Timeframe. Установите панель сегодня и идеально адаптируйте её под свой стиль торговли!
Сводка
Key features include visualization of trend direction through transparent clouds between fast and slow moving averages (EMA and Wilder MA), true MTF overlays that plot higher timeframe EMAs on lower timeframe charts without distortion, and built-in alerts for EMA crossovers. It incorporates a smart algorithm with ATR and RSI filters to detect trend exhaustion and momentum peaks, signaling potential pullbacks or take-profit zones.
The indicator also supports Ichimoku Kijun-sen lines as dynamic support/resistance, with multi-timeframe options. Additional tools include color-coded edge status strips indicating higher timeframe trend bias and a dual candle countdown timer for current and higher timeframe candles.
Users have full customization over moving average parameters, UI colors, dashboard positioning, and filter thresholds. This tool suits trend followers, price action traders, day traders, and scalpers seeking institutional-grade multi-timeframe market context in a streamlined interface.