present
注册即可在首次购物时获得 $50 优惠
Trading product for LondonOpenSignal 指标 EMA AI-assisted, image 1
LondonOpenSignal
指标
版本 1.0, Aug 2026
Windows 版、Mac 版
Trading product for LondonOpenSignal 指标 EMA AI-assisted, image 2
Trading product for LondonOpenSignal 指标 EMA AI-assisted, image 3
Trading product for LondonOpenSignal 指标 EMA AI-assisted, image 4
Trading product for LondonOpenSignal 指标 EMA AI-assisted, image 5
注册日期 03/03/2026

说明

它分析的市场数据

London Open Signal 直接从您的经纪商加载附加符号的多年日内历史(M15 或 H1 分辨率,由您选择),并将每个过去的交易日重构为两个窗口:完整的“日”范围(可配置的开始/结束小时)和伦敦交易时段本身(可配置的开盘/收盘时间,以经纪商服务器时间为准)。对于每个历史时段,它模拟两个假设交易——多头和空头——使用固定的止损和目标,如果两者都未触及,则在时段结束时退出,扣除点差和成本的允许值。然后它针对这些结果测试五个简单的想法,以查看哪些(如果有的话)实际上预测了结果:当前的隔夜连胜/连败,星期几,时段开盘价在前一日范围内的位置,与前一日收盘价的跳空,以及前一日的范围是否异常宽或窄。

如何解读信号和视觉元素

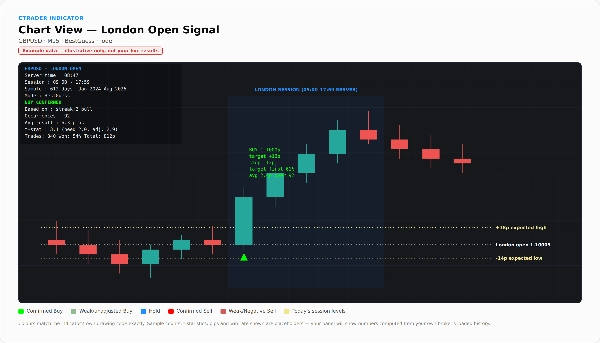
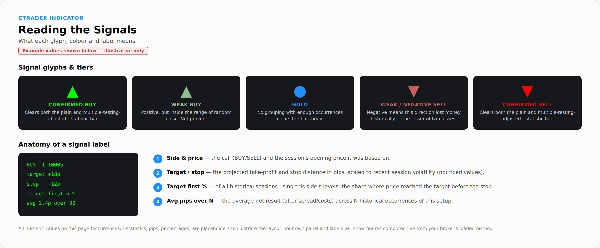
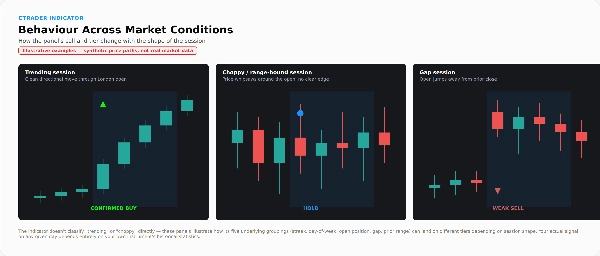
绿色向上箭头表示当天伦敦开盘的买入信号;红色向下箭头表示卖出;蓝点表示持有(未找到可辩护的优势)。这些历史箭头是逐步计算的——每个箭头仅使用该日之前可用的数据,绝不使用当天的结果。

图表上的面板(左上角)显示当天的信号和一个等级标签:CONFIRMED、CONFIRMED(未调整)、WEAK 或 NEGATIVE。这告诉您箭头的可信度——WEAK 表示明显优势处于随机噪声范围内,NEGATIVE 表示该方向在历史上实际上亏损,箭头只是两种亏损中较小的一个。面板还显示信号基于的分组、出现次数、平均结果、针对普通和多重测试调整阈值的 t 统计量,以及最重要的——一个持续更新的逐步得分板:工具实际执行的交易次数、胜率、总点数、每笔交易点数和最大回撤。如果该累计总数持平或为负,面板会直接显示。

三个可选叠加层增加细节:完整结果表(测试的每个分组,含样本量和双向 t 统计量)、一个“止损/目标实验室”,显示仅通过调整止损和目标位置胜率如何变化——以说明高胜率不等于真实优势——以及一个时段级别框,显示伦敦时段上涨、下跌和总范围在中位数/75百分位/90百分位的典型大小。今日时段的虚线标记开盘价和按波动率调整的预期高低点。

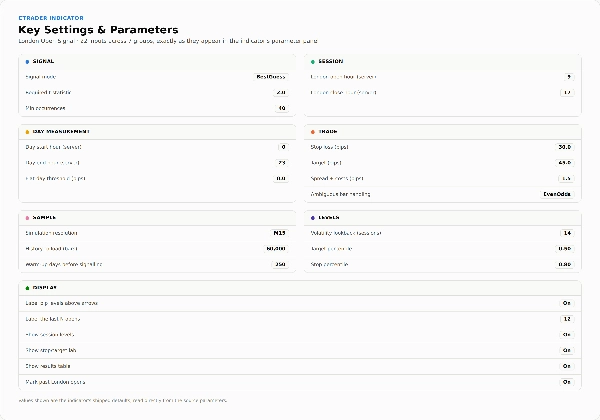
关键设置和参数

  • 信号: 模式(仅确认与最佳猜测)、所需 t 统计量、分组计数的最小出现次数
  • 时段: 伦敦开盘时间,伦敦收盘时间(经纪商服务器时间)
  • 日测量: 日开始/结束时间,平日阈值(点数)
  • 交易: 止损(点数)、目标(点数)、点差/成本允许(点数)、模糊柱处理(悲观 / 均等概率 / 乐观,针对同时触及止损和目标的柱)
  • 样本: 模拟分辨率(H1/M15)、加载历史(柱数)、工具开始发信号前的预热天数
  • 级别: 波动率回溯(时段数)、目标百分位、止损百分位
  • 显示: 标签箭头 / 标签计数,显示时段级别,显示止损-目标实验室,显示结果表,标记过去伦敦开盘

典型用例和交易场景

在伦敦开盘前检查面板,查看当前信号、其等级及当天预期的时段范围。研究某个货币对在其历史中是否有任何简单、可解释的模式在统计上成立——并诚实地查看该模式是否经得起多重测试校正。使用时段级别预测(预期高/低)独立规划目标或止损,而非仅依赖买卖信号。它不适合无人值守的自动执行——它是一个指标,不是 cBot,且从不自行下单。

适合人群

希望看到信号背后实际、逐步验证的业绩记录,而非盲目信任声明的交易者,且能够阅读 t 统计量和回撤数字配合箭头使用。重视时段范围背景的伦敦时段自由裁量交易者,即使他们选择忽略买卖信号。它故意不为寻找即插即用“只跟箭头”系统的人设计——工具会对自身信号进行评级,并会直言不讳地告诉您当数据不支持交易时。

重要限制和使用说明

  • 性能是基于指标运行时实际加载的经纪商历史实时计算的——它不是固定的预生成回测文件,因此结果可能因经纪商/账户而异,且需要足够的加载历史(如果面板报告数据不足,请增加“加载历史”)。
  • 多重测试调整是一种启发式方法,不是保证——调整后的阈值减少了结果仅凭运气看似有意义的可能性,但不能完全消除。
  • 测试的五个想法是简单的单因素分类器,独立检查而非组合——这是为了保持工具的可解释性,避免进一步加剧过拟合风险。
  • 在最佳猜测模式下,指标总是显示一个方向,包括 NEGATIVE 级别信号——务必阅读等级标签,而不仅仅是箭头。
  • 模拟的止损/目标成交假设简化了同时触及两个水平的柱;实际执行可能有所不同。
  • 纯粹基于价格/统计——不包含新闻、基本面或跨资产输入。
  • 仅视觉和分析用途;不执行交易。

摘要

AI summary
LondonOpenSignal is an indicator designed for discretionary traders focusing on the London trading session. It analyzes intraday price data (M15 or H1 resolution) from your broker to reconstruct each trading day into two periods: the full day and the London session, both configurable by start and end hours. For each historical session, it simulates hypothetical long and short trades with fixed stop loss and target levels, accounting for spread and costs, and exits at session close if neither is hit.

The indicator tests five simple, independent factors—overnight streak, day of the week, opening price position within the previous day’s range, gap size, and previous day’s range width—to identify statistically significant edges. Signals are displayed as arrows on the chart: green for Buy, red for Sell, and blue for Hold, with a tier label (CONFIRMED, WEAK, NEGATIVE) indicating the confidence level based on walk-forward testing.

A panel shows detailed statistics including win rate, total pips, t-statistics, and drawdown, updated live from broker data. Optional overlays provide a full results table, stop/target sensitivity analysis, and session-level range projections. The tool is purely analytical and visual; it does not execute trades and is intended for traders comfortable interpreting statistical metrics alongside signals.
指标配置
指标分类
波动性
输出类型
可视化
信号
数据要求
仅 K 线
支持的信号
时段开盘区间

客户评价

0.0
评价:0
客户评价
该产品尚无评价。已经试过了?抢先告诉其他人!

讨论

常见问答

EMA
AI-assisted
Volume
Support & Resistance
cTrader Store 提供的所有产品,包括交易机器人、指标和插件,均由第三方开发者提供,仅供信息参考和技术访问之用。cTrader Store 并非经纪商,不提供投资建议、个人推荐或任何未来业绩保证。

该作者的其他作品

cBot
EMA
SL Manager
+5
Automated London-open breakout cBot for GBPUSD H1, with trend filter and breakeven management.
1.03
盈利系数

猜您喜欢

指标
ATR
EMA
+4
The FULL-MARKET-VIEW-DASHBOARD is a professional-grade trading suite for cTrader that eliminates market noise.
指标
ADX
ATR
+5
Precision Sniper by PrimeQuant: Advanced confluence engine with auto-presets, dynamic TP/SL, and live backtest stats.
指标
Volume
Key Levels
View tick activity across a selected chart range with Point of Control, Value Area High and Value Area Low.
指标
ADX
ATR
+5
EMA-cross signals scored on six confluence layers, with an ATR stop, three targets and a live panel
指标
SMC
VWAP
+16
It calculates Anchored VWAP and StdDev bands from a user-defined start date for cTrader charts.
指标
Forex
Renko scalping indicator
指标
BOS
MSS
+4
See confirmed BOS, CHOCH and SWEEP structure events on your cTrader chart.
指标
ATR
SMC
+17
Adaptive Swing-Anchored VWAP that tracks market structure shifts with precision and clarity.
指标
SMC
Forex
+5
📊 Detects Fair Value Gaps with lower timeframe volume analysis & clean dashboard 🟢🔴
指标
VWAP
Volume
+3
Track hidden trading activities to be on the right side of the market.
指标
Supertrend
Moving Average
Easy Trade: Trend & Breakout Indicator for cTrader
指标
ATR
Forex
+9
Auto-detect swing highs/lows. Spot reversals, map structure, and filter noise with adjustable strength.
指标
Forex
Crypto
+5
Automatically plots Fibonacci retracement levels using the highest and lowest points of a customizable time range
指标
Forex
Crypto
+5
📈 Initial Balance Breakout Signals: visually accurate IB levels, breakout alerts & forecast zones for smart trading.
指标
ADX
ATR
+5
Range-filter BUY/SELL flips with an ATR or swing stop, three targets, five confluence stars and a live panel
指标
EMA
RSI
+5
MACD Colour Histogram with 11 Moving Average Types, Multi-timeframe confirmation and Sound Signal Alert.
指标
SMC
Breakout
+1
Delta Peak Bubbles is a tick‑chart overlay for cTrader that highlights the strongest momentum spikes.
指标
Forex
EURUSD
+5
With this Fibonacci retracement indicator, traders have full control over the retracement levels displayed on the chart.

价格

注册日期 03/03/2026