Descrição
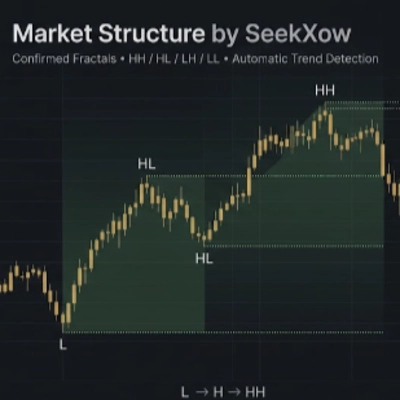
Indicador de price-action projetado para identificar e visualizar a estrutura do mercado usando pivôs fractais confirmados. O indicador acompanha os altos e baixos oscilantes e os classifica em:
- HH — Higher High
- HL — Higher Low
- LH — Lower High
- LL — Lower Low
Ele usa pivôs fractais confirmados para reduzir o ruído e evitar depender de oscilações de preço não confirmadas. Pivôs consecutivos do mesmo tipo são comprimidos para que o extremo relevante seja mantido antes que a estrutura do mercado seja avaliada.
Principais Características
- Detecção de oscilações baseada em fractais confirmados
- Classificação automática HH / HL / LH / LL
- Detecção da estrutura de mercado de alta e baixa
- Identificação automática do estado da tendência
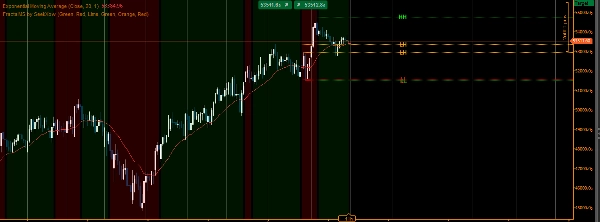
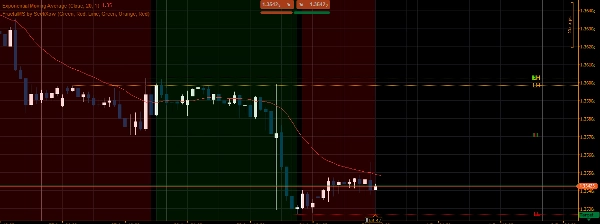
- Níveis visuais horizontais da estrutura
- Visualização do fundo da tendência
- A estrutura se adapta conforme novos pivôs confirmados se desenvolvem
- Projetado para análise discricionária de price-action e estrutura de mercado
Como Funciona
O indicador primeiro detecta os altos e baixos oscilantes confirmados. Esses pivôs são então processados em uma sequência alternada de altos e baixos. A sequência resultante de pivôs é usada para determinar a estrutura atual do mercado e a tendência. Durante uma tendência de alta, novos altos podem estabelecer Higher Highs, enquanto o recuo relevante se torna o Higher Low. A lógica oposta é aplicada durante uma tendência de baixa. Uma quebra do nível estrutural relevante pode desencadear uma mudança na tendência detectada.
Uso Pretendido
O indicador pode ser usado como uma camada de estrutura de mercado junto com price action, suporte/resistência, análise de liquidez ou outras ferramentas técnicas. É adequado para traders que buscam uma representação visual mais limpa da estrutura oscilante em diferentes prazos.
Nota: Este indicador é uma ferramenta de análise técnica e não fornece aconselhamento financeiro nem garante resultados de negociação.
Resumo
Key features include automatic classification of pivot types, bullish and bearish market structure detection, trend-state identification, visual horizontal structure levels, and trend background visualization. The indicator continuously adapts as new confirmed pivots develop.
FractalMS works by detecting confirmed swing highs and lows, processing them into an alternating sequence to determine current market structure and trend. During uptrends, it identifies higher highs and higher lows; during downtrends, it identifies lower highs and lower lows. Breaking structural levels signals potential trend changes.
Designed for discretionary price-action and market-structure analysis, this tool supports traders seeking a clearer visual representation of swing structure across multiple timeframes. It complements other technical tools such as support/resistance and liquidity analysis.