
VWAP Volume Weighted Average Price
Индикатор
Версия 1.0, Oct 2025
Windows, Mac
4.6
Отзывы: 3
Описание
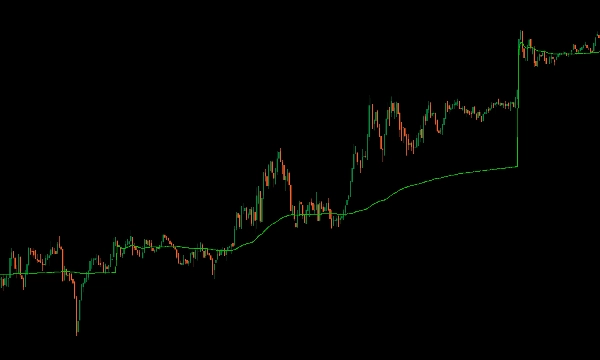
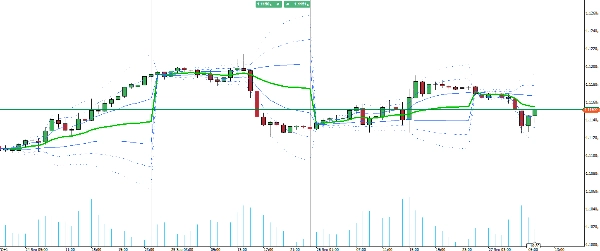
Представляем индикатор VWAP для cTrader, который приносит полную функциональность Volume Weighted Average Price от TradingView на вашу торговую платформу.
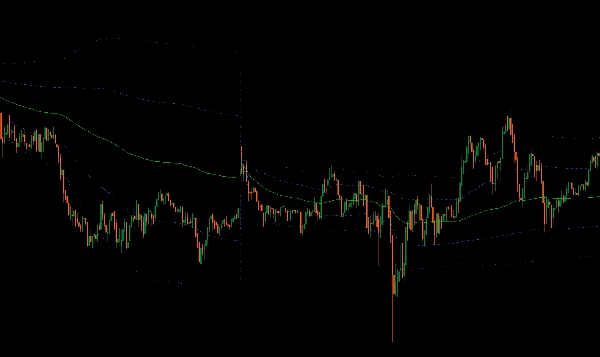
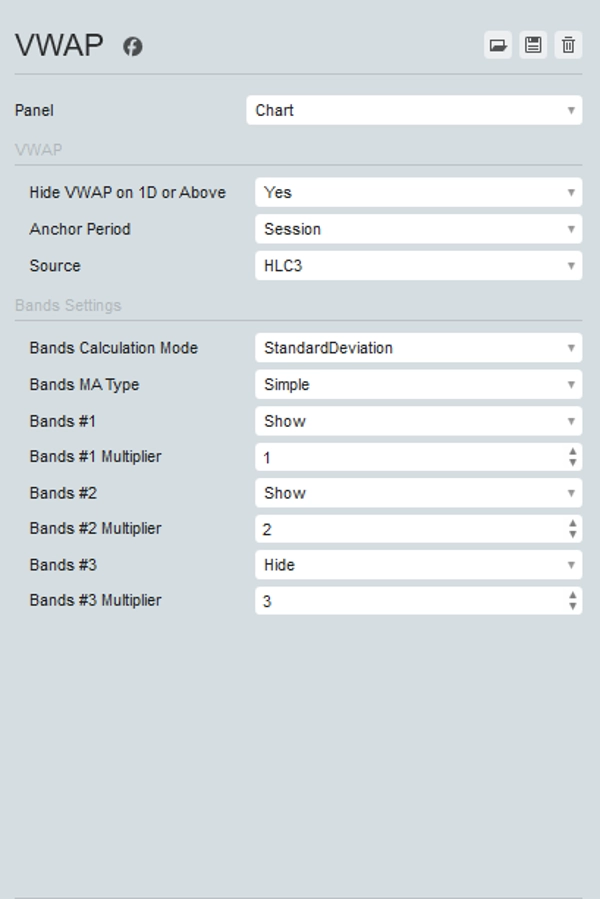
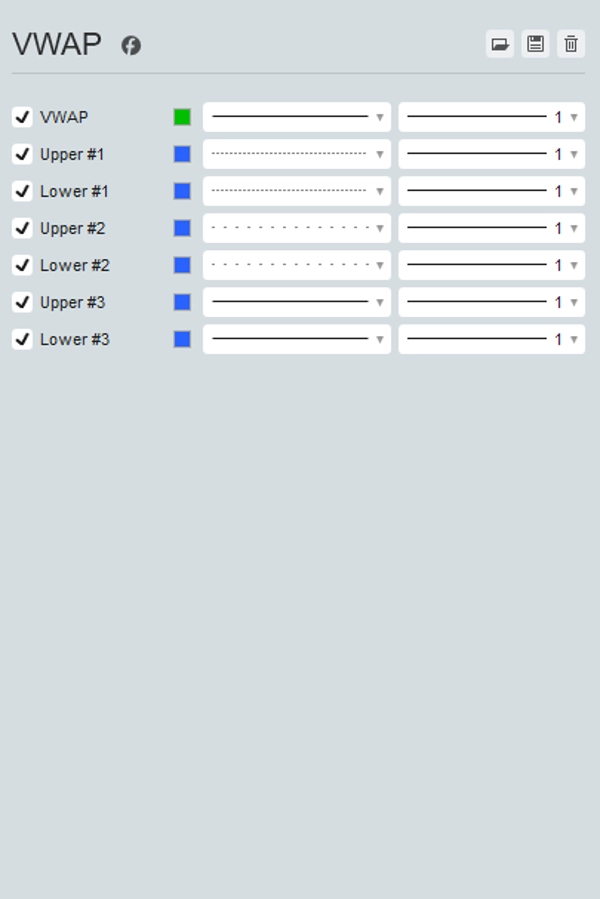
Этот комплексный инструмент позволяет выбирать период якоря (Сессия, Неделя, Месяц, Квартал, Год) и выбирать из различных источников цены, включая Open, High, Low, Close, HL2, HLC3, OHLC4 и HLCC4. Кроме того, он может отображать до трех стандартных отклонений верхних и нижних полос, обеспечивая полный обзор распределения цен.
Индикатор VWAP обновляется в реальном времени с данными тиков, гарантируя, что у вас есть самые точные и своевременные данные для принятия торговых решений. Повышайте свою торговую стратегию с помощью универсального и мощного индикатора VWAP в cTrader.
Сводка
Профиль индикатора
Отзывы покупателей
4.6
Отзывы: 3
5 | 67 % | |
4 | 33 % | |
3 | 0 % | |
2 | 0 % | |
1 | 0 % |
Отзывы покупателей
October 27, 2025
Solid enough as a backup opinion. Win rate means less without average R.
October 22, 2025
it earns a spot because the trade idea gets a pause before execution. A clean signal can still fail.
October 19, 2025
The idea is fine, just do not expect it to print perfect entries, and The result needs a journal.
Обсуждение
Частые вопросы
BTCUSD
Forex
Breakout
Indices
EURUSD
Commodities
GBPUSD
NZDUSD
Prop
Scalping
Crypto
Stocks
XAUUSD
NAS100
USDJPY
VWAP
Продукты, доступные в cTrader Store, включая торговых ботов, индикаторы и плагины, предоставляются сторонними разработчиками и доступны исключительно в информационных и технических целях. cTrader Store не является брокером и не предоставляет инвестиционные консультации, персональные рекомендации или какие-либо гарантии будущей доходности.


Цена
С 25/09/2025
25
Продажи
315
Бесплатные установки