
الوصف
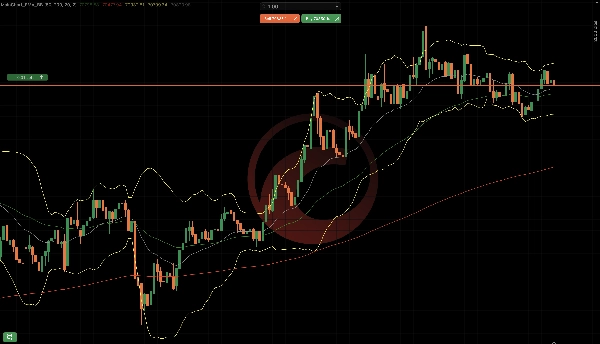
MainChart_EMA_BB هو مؤشر تراكب للرسم البياني الرئيسي لـ cTrader يجمع بين:
- المتوسطات المتحركة الأسية (EMA 50 & EMA 200)
- أشرطة بولينجر (الأعلى / الأوسط / الأسفل)
مكونات المؤشر
المتوسطات المتحركة الأسية (EMA)
متوفر متوسطان متحركان أسيان:
EMADefault PeriodDefault Color
EMA 50
50
أخضر
EMA 200
200
أحمر
الغرض:
- اتجاه الاتجاه
- الدعم / المقاومة الديناميكية
- EMA 50 فوق EMA 200 → ميل صعودي
- EMA 50 تحت EMA 200 → ميل هبوطي
أشرطة بولينجر
تتكون أشرطة بولينجر من:
- الشريط العلوي
- الشريط الأوسط (مبني على EMA)
- الشريط السفلي
الإعدادات الافتراضية:
- الفترة: 20
- الانحراف المعياري: 2.0
- نوع المتوسط المتحرك: أسي
الغرض:
- قياس التقلب
- مناطق الشراء المفرط / البيع المفرط
- لمس السعر للشريط العلوي → احتمال النفاد
- لمس السعر للشريط السفلي → احتمال الارتداد
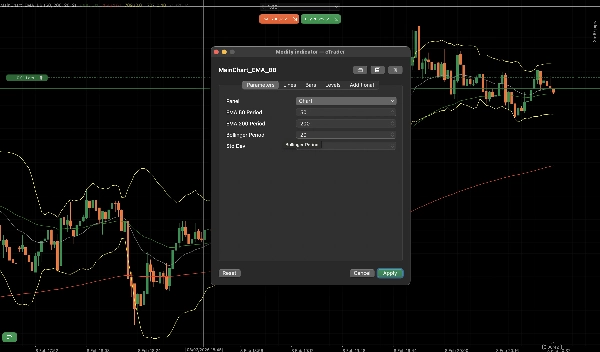
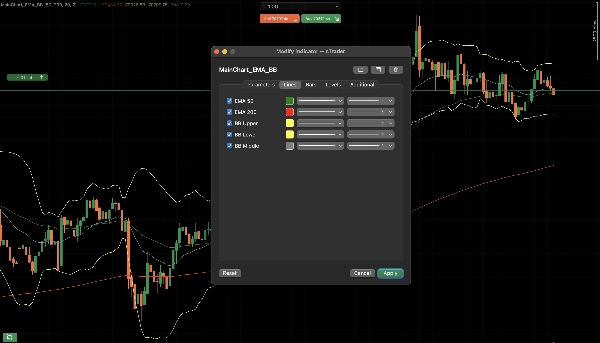
شرح المعلمات
معلمات EMA
- عرض EMA 50: تمكين/تعطيل EMA 50
- فترة EMA 50: فترة الحساب
- عرض EMA 200: تمكين/تعطيل EMA 200
- فترة EMA 200: فترة الحساب
معلمات أشرطة بولينجر
- عرض أشرطة بولينجر: تمكين/تعطيل BB
- فترة BB: فترة النظر للخلف
- انحراف معياري BB: مضاعف التقلب
الاستخدام النموذجي للتداول
تأكيد الاتجاه
- EMA 50 فوق EMA 200
- تفضيل الصفقات الطويلة فقط
الانعكاس / الارتداد
- السعر يرتد إلى EMA 50
- ضغط ثم توسع أشرطة بولينجر
الشيء الجيد في هذا المؤشر هو أنه قابل للتكوين ولا حاجة لإعداد مؤشرات متعددة.
الملخص
ملف تعريف المؤشر
تقييمات العملاء
4.5
التقييمات: 2
5 | 50 % | |
4 | 50 % | |
3 | 0 % | |
2 | 0 % | |
1 | 0 % |
تقييمات العملاء
February 16, 2026
a 1R exit plan makes review easier, and messy areas become easier to avoid.
February 15, 2026
مناقشة
الأسئلة الشائعة
Prop
Forex
Indices
Commodities
Crypto
Stocks
Bollinger
يتم توفير المنتجات المتاحة من خلال cTrader Store، بما في ذلك روبوتات التداول والمؤشرات والإضافات، من قبل مطوري الطرف الثالث وإتاحتها لأغراض الوصول المعلوماتي والفني فقط. cTrader Store ليس وسيطًا ولا يقدم نصائح استثمارية أو توصيات شخصية أو أي ضمان للأداء المستقبلي.
المزيد من هذا المؤلف


![شعار "[Stellar Strategies] MARSI Signal Plotter"](https://cdn.ctrader.com/image/webp/7b2b8da6-8f8e-4646-8d4a-4710c516c01e_25567)


السعر
منذ 01/04/2025