
説明
VOLUME HEATMAP PRO - プロフェッショナルな市場密度の可視化
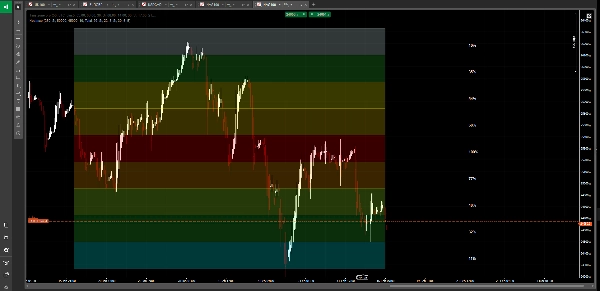
複雑な出来高データを直感的なビジュアル表示に変換するこの高度なボリュームヒートマップで、市場をこれまでにない形でご覧ください。チャートの下部にバーのみを表示する従来の出来高指標とは異なり、Volume Heatmap Proは機関投資家が各価格レベルでどこにポジションを蓄積し分配しているかを正確に明らかにします。
主な特徴:
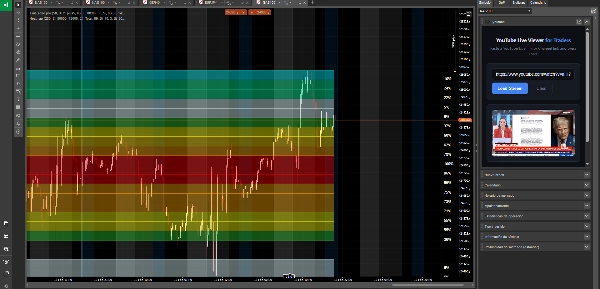
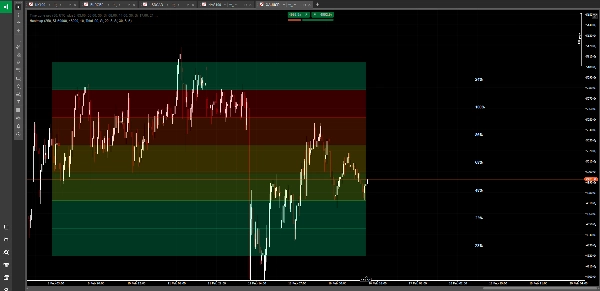
🔥 ダイナミックな色分けヒートマップ
10段階の色のグラデーションシステムを通じて出来高分析を体験してください。氷のような青(最小活動)から燃えるような赤(最大出来高)まで、大口資金の流れを瞬時に識別できます。ヒートマップはリアルタイムで更新され、市場の密度を一目で示します。
📍 コントロールポイント(POC)検出
最も取引量の多い価格レベルを自動的に特定し強調表示します。これは市場の真の均衡点であり、機関が最大のポジションを築き、価格が戻りやすい場所です。
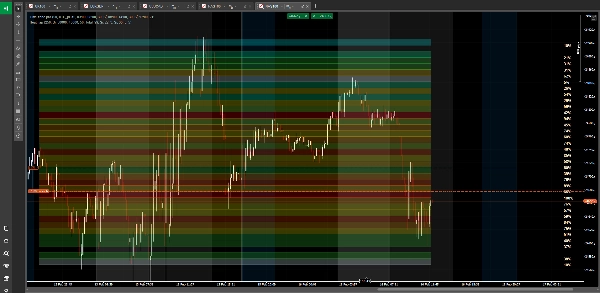
🎯 マルチレベル出来高分布
価格範囲を最大50の正確なレベルに分割し、詳細な出来高分布マップを作成します。どの価格が活発に取引され、どの価格が市場に無視されたかを正確に把握できます。
📊 3つの出来高分析モード
• 総出来高 - すべての市場活動を表示
• 買い出来高のみ - 強気圧力ゾーンを分離
• 売り出来高のみ - 弱気分配エリアを特定
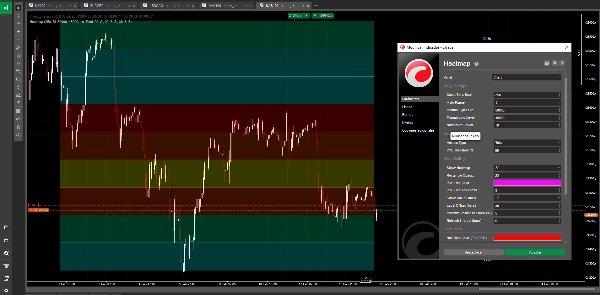
🎨 プロフェッショナルな可視化
• 分析期間全体にわたる色分けされた長方形
• 完璧なチャート統合のための調整可能な不透明度
• 各レベルのオプションの出来高パーセントラベル
• 厚さ調整可能なカスタマイズ可能なPOCライン
• クリーンで邪魔にならない表示
⚙️ スマートオートレンジ技術
ルックバック期間から最適な価格範囲を自動計算、または特定の分析のために手動で範囲を定義可能。ヒートマップはあらゆる市場状況や時間枠に適応します。
🔄 パフォーマンス最適化
設定可能な更新間隔により、正確な出来高分析を維持しつつスムーズなチャートパフォーマンスを実現。最大500本のバーを遡って遅延なく分析可能。
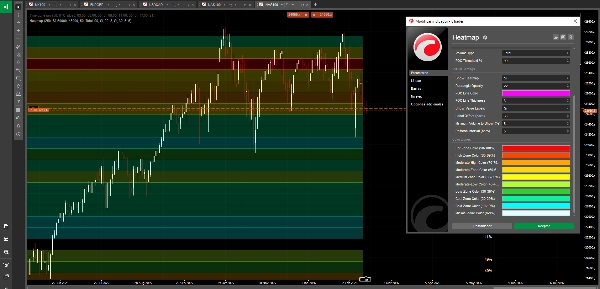
📈 カスタマイズ可能なカラ―ゾーン
すべての10色ゾーンをあなたの視覚的好みに合わせてパーソナライズ:
• ホットゾーン (90-100%) - 最大出来高集中
• ハイゾーン (80-89%) - 強い活動
• モデレートハイ (70-79%) - 平均以上の出来高
• モデレート (60-69%) - 堅実な活動
• ミディアム (50-59%) - 平均的な出来高
• モデレートロー (40-49%) - 平均以下
• ローゾーン (30-39%) - 軽い活動
• クールゾーン (20-29%) - 最小限の取引
• コールドゾーン (10-19%) - 非常に軽い出来高
• ミニマル (0-9%) - ほとんど活動なし
こんな方に最適:
• 機関投資家の蓄積および分配ゾーンの特定
• ブレイクアウトの可能性がある低出来高ノードの発見
• 高出来高のサポートおよびレジスタンスレベルの把握
• 市場構造と流動性の理解
• 高出来高エリアでのトレードエントリーの確認
• 低流動性のトラップゾーンの回避
• マルチタイムフレームの出来高プロファイル分析
他と違う点:
従来の出来高指標は「どれだけ取引されたか」は示しますが、「どこで取引されたか」は示しません。Volume Heatmap Proは完全な全体像を明らかにします。取引活動が最も集中した価格レベルを示す視覚的な密度マップです。グラデーションカラーシステムにより、複雑な出来高分析が天気図を読むように簡単になります。赤はホット(大量出来高)、青はコールド(少量出来高)を意味します。
デイトレードのリバーサルをスキャルピングする場合でも、スイングトレードのポジショニングをする場合でも、このヒートマップは市場の真の確信がある場所と単なるノイズの場所を示します。
---
⚠️ リスク免責事項:
外国為替、暗号通貨、その他の金融商品を取引することは高いリスクを伴い、すべての投資家に適しているわけではありません。高いレバレッジはあなたにとって有利にも不利にも働く可能性があります。取引を決定する前に、投資目的、経験レベル、リスク許容度を慎重に検討してください。投資の一部または全部を失う可能性があります。したがって、失っても問題ない資金のみを投資すべきです。取引に関連するすべてのリスクを認識し、疑問がある場合は独立した金融アドバイザーに相談してください。過去のパフォーマンスは将来の結果を保証するものではありません。
概要
Key features include automatic Point of Control (POC) detection, highlighting the price level with the highest trading volume, and multi-level volume distribution dividing the price range into up to 50 levels for detailed analysis. It supports three volume modes: total volume, buy volume only, and sell volume only, enabling users to isolate bullish or bearish pressure zones.
The indicator offers professional visualization with adjustable opacity, customizable color zones, optional volume percentage labels, and a customizable POC line. Smart auto-range technology calculates optimal price ranges based on the lookback period or manual input. Performance is optimized for smooth updates and analysis of up to 500 bars without lag.
Heatmap is suitable for identifying institutional accumulation and distribution zones, spotting support and resistance levels, understanding market structure, and conducting multi-timeframe volume profile analysis across markets including Forex, indices, and XAUUSD (gold).
カスタマーレビュー
5 | 67 % | |
4 | 33 % | |
3 | 0 % | |
2 | 0 % | |
1 | 0 % |


