
ChoppinessIndex
مؤشر
101 التنزيلات
الإصدار 1.0، Mar 2026
Windows, Mac
الوصف
كيف يعمل
- الفترة: الافتراضية 14. يحسب المؤشر نسبة مجموع نطاقات الأعلى-الأدنى خلال الفترة إلى النطاق الحقيقي عبر نفس الفترة، ثم يضبط النتيجة باستخدام صيغة لوغاريتمية: التقلب = 100 * log10(مجموع(النطاق) / النطاق الحقيقي) / log10(الفترة)
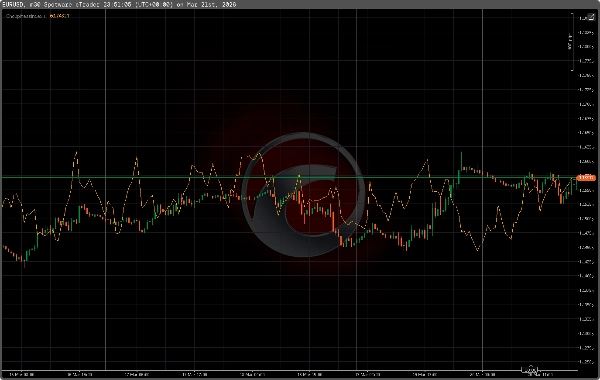
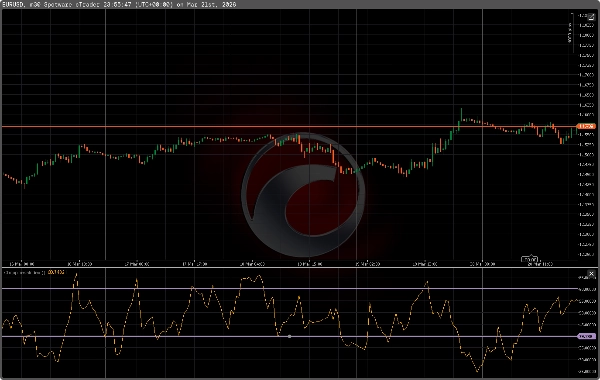
- المخرجات: خط واحد مسمى "CMI" (برتقالي بشكل افتراضي) حيث:
-
- القيم العالية = السوق متقلب/محدد النطاق (تجنب التداولات الاتجاهية أو انتظر تأكيد الاختراق)
- القيم المنخفضة = السوق في اتجاه (ابحث عن فرص متابعة الاتجاه)
التفسير والإعدادات النموذجية
- الفترة الافتراضية: 14 (اضبطها بين 7–28 حسب الإطار الزمني والسوق).
- العتبات الشائعة (مقترحة وقابلة للتعديل):
-
- أعلى من ~61.8 → متقلب للغاية / محدد النطاق
- 38.2–61.8 → مختلط / تجميع
- أقل من ~38.2 → سوق في اتجاه (حركة اتجاهية قوية)
- الأطر الزمنية:
-
- استخدم أطر زمنية أعلى (H1، H4، يومي) لتأكيد الاتجاه وتداولات التأرجح.
- استخدم أطر زمنية أقل (M5–M30) مع فترة مخفضة لإعدادات السكالبينج.
- الأسواق: يعمل على الفوركس، الذهب/الفضة (XAUUSD/XAGUSD)، المؤشرات والعملات المشفرة. الأداء يعتمد على ملف تقلب الأداة.
كيفية الاستخدام في استراتيجية
- مرشح الاختراق: خذ فقط دخول الاختراق عندما يكون CMI أقل من عتبة الاتجاه الخاصة بك (مثلاً، <38).
- تأكيد الاتجاه: اجمع مع مؤشر اتجاه (المتوسطات المتحركة، Supertrend) و/أو مؤشرات الزخم (MACD، RSI) — ادخل الصفقات عندما يؤكد كلا من الاتجاه/الزخم ويشير CMI إلى بيئة اتجاهية.
- تجنب ضوضاء الإشارة: عندما يكون CMI فوق عتبة التقلب (مثلاً، >61)، قم بتأجيل التداولات الاتجاهية أو شد نقاط التوقف.
- مزاوجة التقلب: استخدم ATR أو Bollinger Bands لتحديد حجم المخاطرة وتأكيد أنظمة التقلب.
المؤشرات المكملة
- ADX (قوة الاتجاه)، ATR (التقلب)، MACD / RSI (الزخم)، Supertrend أو المتوسطات المتحركة (اتجاه الاتجاه)، Bollinger Bands (النطاق/التقلب).
التثبيت والمعلمات
- المعلمة: الفترة (الافتراضية 14).
- اسم المخرجات: CMI (برتقالي).
- غير معيد الرسم: القيم محسوبة على الأشرطة المكتملة؛ استخدم إدارة المخاطر والتأكيدات المعتادة.
تنبيه المخاطر هذا المؤشر يوفر إشارات معلوماتية لدعم اتخاذ القرار. ليس نظام تداول مستقل. قم باختبار الإعدادات والتحقق منها لأدواتك وأطرك الزمنية. استخدم دائماً إدارة المخاطر والمال المناسبة.
الملخص
ملخص الذكاء الاصطناعي
The Choppiness Index (CMI) is a technical indicator designed to distinguish trending markets from ranging (choppy) markets, aiding traders in filtering breakout signals and improving trend-following entries. It calculates the ratio of the sum of high–low price ranges over a specified period (default 14) to the true range, then applies a logarithmic scale to produce a single output line labeled "CMI."
Key functionality includes:
- High CMI values indicate a choppy or range-bound market, suggesting caution with directional trades or waiting for breakout confirmation.
- Low CMI values signal trending markets, highlighting opportunities for trend-following strategies.
- Adjustable period settings (7–28) allow tuning based on timeframe and market conditions.
- Suggested thresholds: above ~61.8 for choppy markets, 38.2–61.8 for consolidation, and below ~38.2 for trending conditions.
- Suitable for multiple markets including Forex, commodities (gold, silver), indices, cryptocurrencies, and stocks.
- Recommended use on higher timeframes (H1, H4, Daily) for trend confirmation and swing trading, and on lower timeframes (M5–M30) with shorter periods for scalping.
- Can be combined with other indicators such as ADX, ATR, MACD, RSI, Supertrend, and Bollinger Bands for enhanced strategy development.
- Non-repainting values are calculated on completed bars to support reliable analysis.
This indicator serves as an informational tool to support trading decisions and should be used alongside proper risk management and complementary indicators.
ملف تعريف المؤشر
تقييمات العملاء
0.0
التقييمات: 0
تقييمات العملاء
لا توجد تقييمات لهذا المنتج حتى الآن. هل جرَّبته بالفعل؟ كن أول من يخبر الآخرين!
مناقشة
الأسئلة الشائعة
Forex
Signal
Breakout
Scalping
Indices
Commodities
Crypto
Stocks
يتم توفير المنتجات المتاحة من خلال cTrader Store، بما في ذلك روبوتات التداول والمؤشرات والإضافات، من قبل مطوري الطرف الثالث وإتاحتها لأغراض الوصول المعلوماتي والفني فقط. cTrader Store ليس وسيطًا ولا يقدم نصائح استثمارية أو توصيات شخصية أو أي ضمان للأداء المستقبلي.
المزيد من هذا المؤلف


السعر
منذ 16/01/2025
2.73M
حجم التداول
1.98K
الربح بالبيب
285
التثبيتات المجانية