
present
가입하고 첫 구매 시 $50 할인을 받으세요
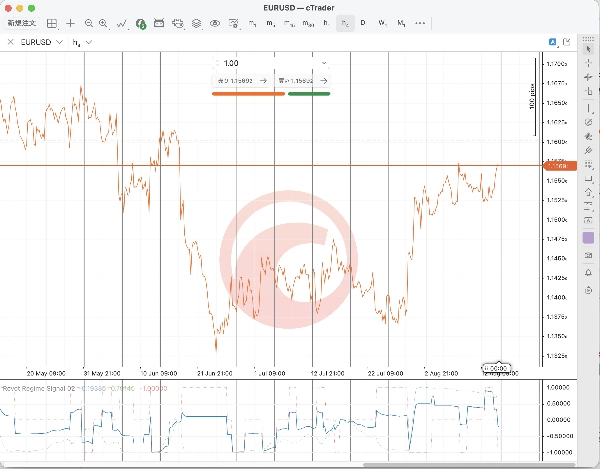
Trading product for Regime Compass 지표 EMA, image 2
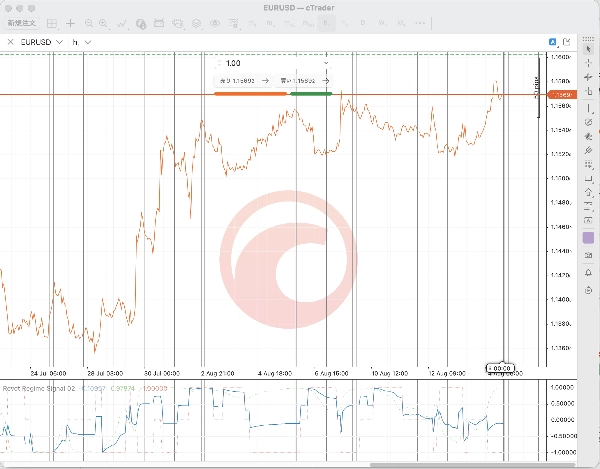
Trading product for Regime Compass 지표 EMA, image 3
Trading product for Regime Compass 지표 EMA, image 4
가입일 15/08/2026

설명

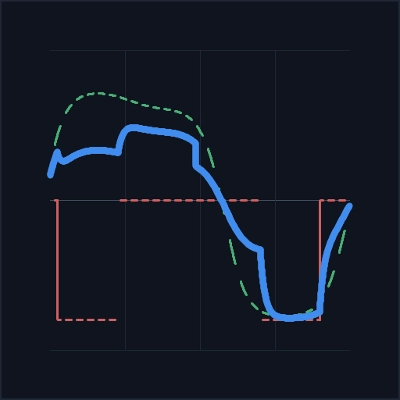
그림에 그려지는 것


차트 아래 서브 패널에 세 개의 선.


블렌드 신호, 파란색 실선. -1과 +1 사이에 유지되는 결합 값.


추세 구성 요소, 녹색 점선. 추세 절반 자체.


반전 구성 요소, 빨간색 점선. 평균 회귀 절반 자체.


두 절반을 별도로 보는 것이 요점입니다. 두 절반이 다를 때, 블렌드는 0 근처에 위치하며 어느 쪽이 끌어당기는지 볼 수 있습니다.


계산 방법


추세 절반은 빠른 EMA와 느린 EMA의 비율에서 1을 뺀 값을 취합니다. 그 상대적 거리는 자체 이력에 대해 표준화되고, 경계가 설정되며, tanh를 통과하여 현재 분리의 비정상성을 기준으로 선이 스케일링되도록 하여 교차점마다 선이 뒤집히지 않게 합니다.


반전 절반은 고정된 조회 기간 동안 종가의 z-점수입니다. 상태는 z-점수가 진입 수준에 도달하면 한쪽으로, 반대 수준에서는 다른 쪽으로 전환되며, z-점수가 종료 밴드 안으로 다시 떨어지면 평탄해집니다. 그 사이에는 이전 상태를 유지하므로 빨간 선이 연속적으로 움직이지 않고 단계적으로 움직입니다.


가중치는 단기 윈도우 수익 변동성과 장기 윈도우 수익 변동성을 비교합니다. 단기 윈도우가 장기 윈도우에 비해 활발할 때 블렌드는 추세 절반 쪽으로 기울고, 그렇지 않으면 반전 절반 쪽으로 기울입니다. 시장이 움직일 때는 따라가고, 조용할 때는 반대로 움직입니다.


결정 타이밍


모든 계산은 완료된 바에서만 수행됩니다. 형성 중인 바는 절대 그려지지 않으므로 이미 본 값은 이후에 변경되지 않습니다. 반전 상태는 닫힌 바마다 정확히 한 번 진행되므로 차트 재계산 시 동일한 이력을 재생하며 중복 계산하지 않습니다.


하지 않는 것


주문을 배치, 수정, 취소 또는 종료하지 않습니다. 차트 심볼 자체의 바만 읽습니다. 네트워크 접근, 파일 접근, 외부 데이터 피드가 없습니다.


표시용입니다. 예측하지 않으며 모든 거래 결정은 사용자에게 있습니다.


매개변수


추세 기간, 반전 조회 기간, 진입 및 종료 수준, 두 변동성 윈도우 및 가중치는 이 빌드에서 고정되어 있습니다. 보이는 선은 특정 구성 하나이며, 조정하여 맞추는 표면이 아닙니다.


범위


이 지표는 하나의 기기와 하나의 과거 창에서 개발 및 검증되었습니다. 이는 다른 심볼, 다른 시간 프레임 또는 다른 기간에서의 동작을 보장하지 않습니다. 실제 거래하는 기기에서 데모 계정으로 실행하여 동작이 적합한지 직접 판단하십시오.


거래에는 손실 위험이 따릅니다.


지원


질문은 영업일 기준 3일 이내에 답변됩니다. 버전 기록은 변경 시마다 게시됩니다.

요약

AI 요약
Regime Compass is a trading indicator that visualizes market conditions by blending trend and mean-reversion signals within a volatility regime. It displays three lines in a sub-panel below the price chart: a solid blue line representing the combined signal scaled between -1 and +1, a green dotted line showing the trend component alone, and a red dotted line indicating the mean-reversion component. The trend component is derived from the ratio of a fast to a slow exponential moving average (EMA), standardized and bounded to reflect the strength of the trend. The mean-reversion component is a stepwise z-score of closing prices over a fixed lookback, indicating reversion states based on entry and exit thresholds. The blend between these components is weighted by comparing short-term and long-term return volatilities, favoring trend signals during high volatility and mean-reversion signals during low volatility. All calculations are performed on completed bars only, ensuring stable and consistent values without intra-bar updates. The indicator does not execute trades or access external data; it solely reads the chart’s own bar data. Parameters such as trend periods, lookbacks, and volatility windows are fixed in this version. Regime Compass is designed for visualization and decision support, with applicability depending on the instrument and timeframe used.
지표 프로필
지표 카테고리
추세
출력 유형
시각화
데이터 요구 사항
막대만
지원되는 신호
추세 강도
반전
변동성

상담

고객 리뷰

0.0
리뷰: 0
고객 리뷰
이 상품에 대한 리뷰가 아직 없습니다. 이미 사용해 보셨나요? 다른 사람들에게 가장 먼저 소개해 주세요!

자주 묻는 질문(FAQ)

EMA
트레이딩 봇, 지표, 플러그인 등 cTrader Store에서 제공되는 상품은 제3자 개발자에 의해 제공되며, 이는 단순히 정보 및 기술적 접근을 목적으로 제공된 것입니다. cTrader Store는 중개인이 아니며, 투자 조언, 개인별 추천 또는 향후 성과에 대한 어떠한 보장도 제공하지 않습니다.

좋아하실 만한 다른 항목

지표
Doji
Engulfing
+1
Mide en puntos la distancia entre el Máximo y el Mínimo alcanzados por cada vela, incluida la vela actual.
지표
Signal
Order Flow Market Depth Pro | Footprint & DOM
지표
Volume
Imbalance
+2
FOOTPRINT PRO - Candles tell you where price moved
지표
Volume
Key Levels
+1
SMART DOM FOOTPRINT is an order flow analysis tool for cTrader that combines Depth of Market (DOM), Footprint Clusters.
지표
Signal
Indices
The **Whale Hunting Indicator** is a trading tool for **Boom & Crash and Volatility indices**, featuring **Auto Trend De
지표
ATR
RSI
+5
Track relative momentum, spot market reversals, & isolate trend strength over 7 major cryptocurrencies simultaneously
지표
Forex
Crypto
+5
Volume Imbalance Bars Indicator - brings institutional-grade market microstructure analysis to cTrader.
지표
VWAP
Fibonacci
+5
Market Blueprint - SMC/ICT One Indicator. Eleven Core Module, Single Chart , MTF candles, MTF FVG
지표
AI
ATR
+15
AI-powered Smart indicator. Dual neural networks self-train on live trades. Liquidity sweep + SMC. All pairs/timeframe.
지표
Prop
Forex
+13
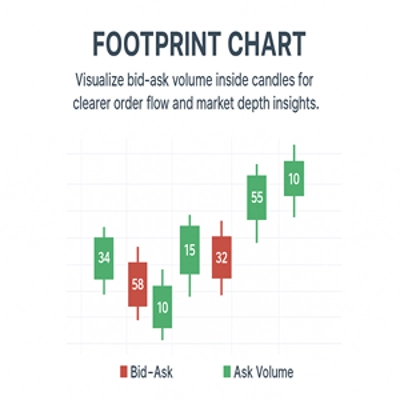
"Footprint Chart: Visualize bid-ask volume inside candles for clearer order flow and market depth insights."
지표
ADX
ATR
+5
🚀 All-in-one Trend & Momentum indicator with MTF Dashboard, Entry/Exit Signals, Neutral Zone Filter & Auto SL/TP1-TP3.
지표
ADX
ATR
+5
HAI QUANTUM V7.0 | The Stochastic Drift & Gravity Edition The Most Advanced Neural-Ready Trading Dashboard for cTrader
지표
Forex
Signal
+4
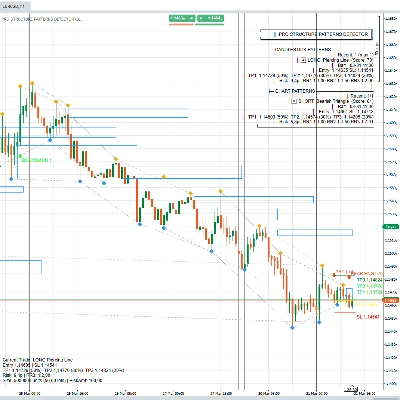
Pro Structure & Candlestick Patterns Detector
지표
ATR
A multi-currency indicator that tracks the relative strength of eight global currencies across every timeframe available
지표
AI
ATR
+9
Scalp smarter with DOM Flow Scalper PRO – real-time Bid/Ask imbalance and volume precision!
지표
Prop
Forex
+15
Footprint volume indicator showing bid/ask splits at each price level
지표
AI
Prop
+16
Pro trading dashboard: WVAP analysis + Volume Profile + Neural AI tracking + News alerts. All-in-one tool!
지표
SMC
Pro Volume Profile with Delta, Session Filters & CSV Export. Precision order flow analysis.

가격

가입일 15/08/2026