الوصف
نظرة عامة على المؤشر
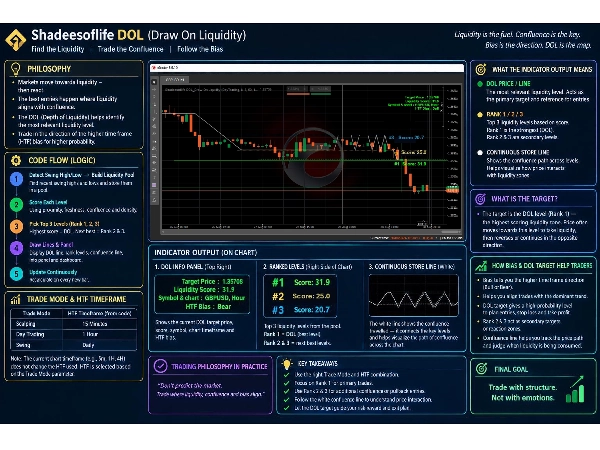
مؤشر Shadeesoflife DOL (الرسم على السيولة) لمتداول c Trader يقدم محرك تحديد أهداف ديناميكي يعتمد على مفاهيم المال الذكي (SMC) ومبادئ ICT. يقوم تلقائيًا برسم خط على السيولة (DOL)، يصنف ويتتبع تجمعات السيولة الهيكلية - "تلاقي عالي" عبر السوق في كل نبضة. DOL هو هدف ديناميكي، سيولة ذات تلاقي عالي.
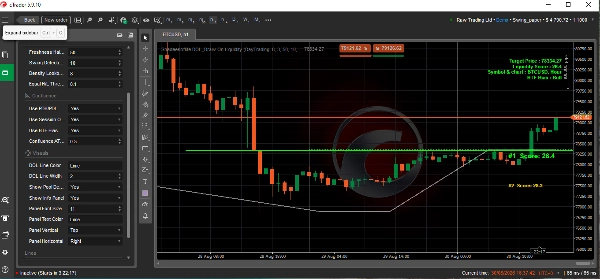
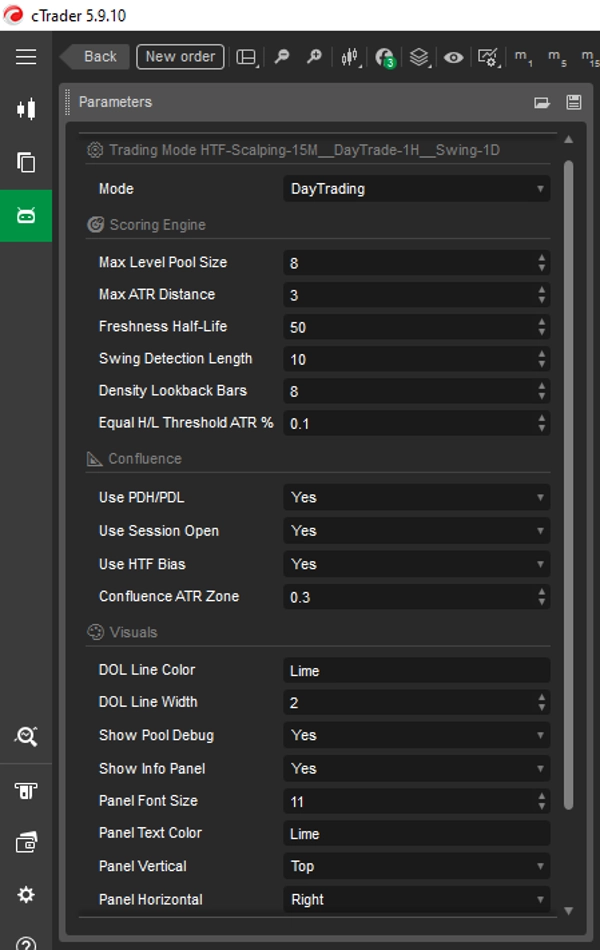
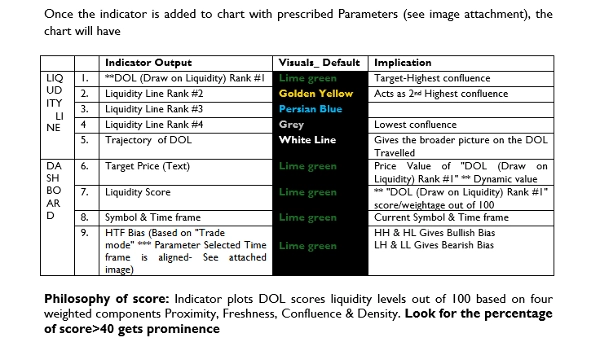
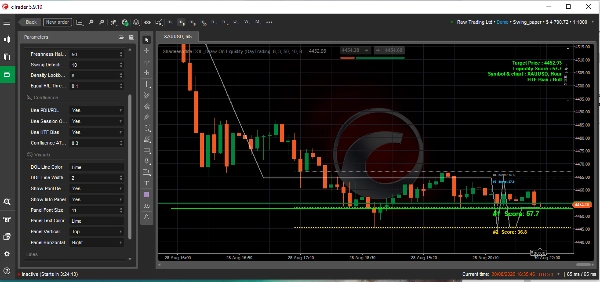
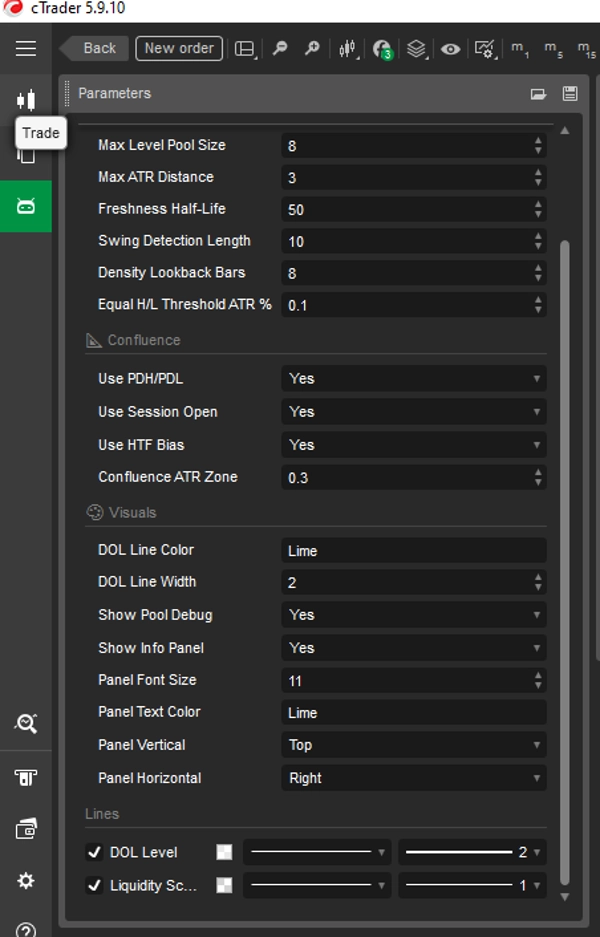
يخرج المؤشر هدف DOL أساسي (المستوى الأعلى تقييمًا، معروض كخط بارز) إلى جانب تجمع مصنف من أهداف السيولة الثانوية، مع توفير لوحة على الشاشة تعرض الانحياز الحالي للإطار الزمني الأعلى HTF ومقاييس الهدف. بمجرد إضافة المؤشر إلى الرسم البياني مع المعلمات المحددة (انظر المرفق الصوري)، سيكون لدى الرسم البياني
للإجابة - راجع الصورة المرفقة (الجدول).
فلسفة التقييم: يقوم المؤشر برسم درجات DOL لمستويات السيولة من 100 بناءً على أربعة مكونات موزونة القرب، الجدة، التلاقي & الكثافة.
الأسئلة الشائعة
1. كيف يعمل - إطار استراتيجية متعدد الأطر الزمنية HTF & LTF؟؟
تحديد انحياز واتجاه الإطار الزمني الأعلى (HTF)
يحدد المؤشر الانحياز الهيكلي باستخدام اختيار وضع التداول الأساسي للإشارة إلى إطار زمني أعلى (مثل، ***اليومي للتأرجح، ساعة واحدة للتداول اليومي، 15 دقيقة للتداول السريع):
- انحياز HTF صاعد:
- الشرط: يُغلق شمعة HTF أعلى من فتحها (HTF صاعد).
- سلوك المؤشر: يعرض محرك التقييم أن سعر الهدف (#1 خط مصنف) محدد أسفل سعر العرض/الطلب (يُظهر هدف HTF السيولة الداخلية ويُظهر سعر هدف LTF السيولة الخارجية).
- تأثير التداول: السعر يبحث عن سيولة جانب البيع (SSL) أدناه لتصحيح مخفض قبل الاستمرار صعودًا، أو يستهدف سيولة جانب الشراء (BSL) أعلاه كهدف التوسع النهائي.
- انحياز HTF هابط:
- الشرط: يُغلق شمعة HTF أقل من فتحها (HTF هابط).
- سلوك المؤشر: يعرض محرك التقييم أن سعر الهدف (#1 خط مصنف) محدد أعلى من سعر العرض/الطلب (يُظهر هدف HTF السيولة الداخلية ويُظهر سعر هدف LTF السيولة الخارجية).
- تأثير التداول: السعر يبحث عن سيولة جانب الشراء (BSL) أعلاه لتصحيح علاوة قبل التحرك هبوطًا، أو يستهدف سيولة جانب البيع (SSL) أدناه.
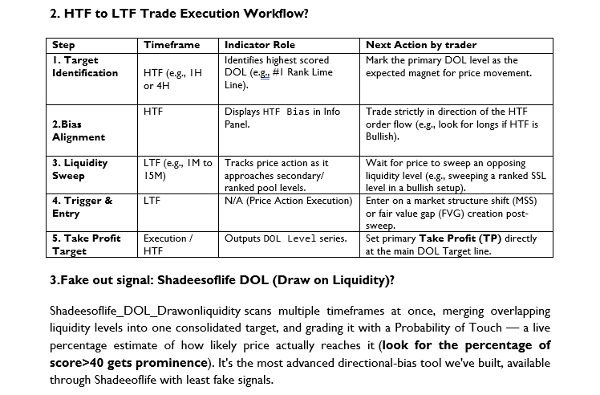
2. سير عمل تنفيذ التجارة من HTF إلى LTF؟
للإجابة - راجع الصورة المرفقة (الجدول).
3. إشارة خاطئة: Shadeesoflife DOL (الرسم على السيولة)؟
"Shadeesoflife DOL Draw on liquidity" يفحص عدة أطر زمنية في آن واحد، مدمجًا مستويات السيولة المتداخلة في هدف موحد، ويقيمه باحتمالية اللمس — تقدير نسبة مئوية حية لمدى احتمال وصول السعر إليه (ابحث عن نسبة التقييم>40 التي تحظى بالأولوية). إنه أكثر أدوات الانحياز الاتجاهي تقدمًا قمنا بتطويرها، متاحة عبر Shadeeoflife مع أقل الإشارات الخاطئة.
4. كيف يعمل التلاقي في "Shadeesoflife DOL Draw on liquidity" تقنيًا؟
"Shadeesoflife DOL Draw on liquidity" يفحص السيولة الداخلية، السيولة الخارجية، كتل الأوامر، كتل الكاسر، FVGs، iFVGs، و BSL/SSL لانحيازه الاتجاهي. يعمل DOL Pro على محرك مختلف تمامًا — يفحص EQH/EQL، FVGs الكبيرة، حدود الجلسة، PDH/PDL، والفجوات الليلية/نهاية الأسبوع عبر أطر زمنية متعددة، يقرأ انحياز الجلسة مثل تأرجحات يهوذا والاستمراريات، ويقيم هدفه باحتمالية لمس حية، مع خوارزميات أكثر ذكاءً. نفس مهمة الانحياز الاتجاهي مثل DOL، مبني على محرك أكثر صرامة. يعطي نتيجة إعداد احتمالي عالي من خلال توفير الاتجاه وهدف تلاقي أعلى.
يقرأ عدة أطر زمنية في آن واحد، وليس واحدًا فقط، يفحص EQH/EQL، FVGs الكبيرة، حدود الجلسة، PDH/PDL، والفجوات الليلية/نهاية الأسبوع. يقرأ انحياز الجلسة — أنماط مثل تأرجحات يهوذا والاستمراريات.
┌──────────────────────────────────────┐
│ مفاهيم ICT / السيولة │
│ DOL • PDH • PDL • الجلسة • HTF │
│ السيولة • القمة/القاع المتساوي │
└──────────────────┬───────────────────┘
↓
┌──────────────────────────────────────┐
│ طبقة SMC / الهيكلية │
│ القمة المتأرجحة • القاع المتأرجح │
│ تجمعات السيولة • اتجاه HTF │
└──────────────────┬───────────────────┘
↓
┌─────────────────────────────────────────┐
│ محرك SHADEESOFLIFE الكمي │
│ القرب X% + الجدة Y% + التلاقي Z% + الكثافة A% │
│ │
│ → 0–100 درجة → الترتيب #1/#2/#3 → DOL ديناميكي │
└─────────────────────────────────────────┘
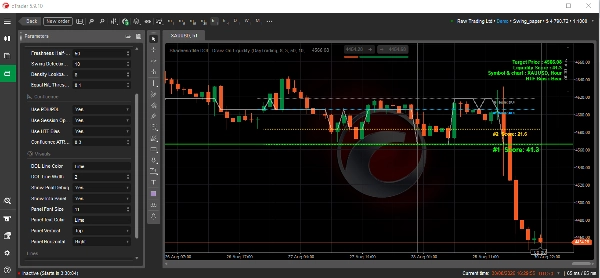
📊تحليل الرسم البياني الفني (تفسير الصورة المرفقة)
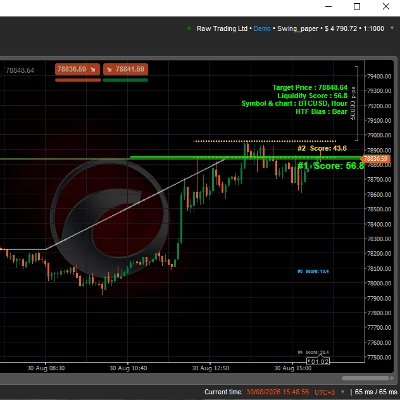
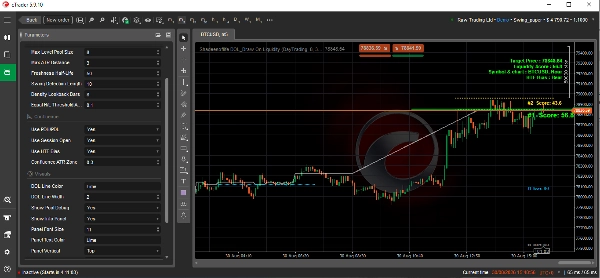
يعرض هذا الرسم البياني من منصة التداول cTrader زوج BTCUSD (بيتكوين / الدولار الأمريكي) على إطار زمني 5 دقائق (m5). يتميز بمؤشر هيكل السوق الآلي المخصص المسمى "Shadeesoflife DOL Draw On Liquidity"، والذي تم تكوينه باستخدام مفاهيم المال الذكي (SMC).
🔎 المقاييس الفنية الرئيسية والتحليل
- السعر الحالي: الأصل يتداول عند 78,856.48، محصورًا بإحكام ضمن نطاق ضيق عالي السيولة.
- سعر الهدف / الرسم على السيولة (DOL): محدد بالخط الأفقي الأخضر الساطع عند 78,848.64. هذا يعمل كمغناطيس بارز لحركة السعر.
- درجة السيولة (57.3): درجة معتدلة تشير إلى وجود أوامر مؤسسية مستقرة ولكن ليست طاغية حول هذه الجيب.
- انحياز الإطار الزمني الأعلى (HTF): موسوم صراحةً على أنه هابط (هبوط). النظام يبحث عن استمرار هبوطي بمجرد إزالة سيولة الشراء المستقرة.
- درجات الأولوية الخوارزمية:
- #1 درجة (57.3): موجودة مباشرة عند خط الهدف الأخضر.
- #2 درجة (45.8): مستقرة قليلاً أعلى عند مستوى الخط الأساسي الأحمر.
💡 التفسير الاستراتيجي الأساسي
يقوم المؤشر برسم إعداد SMC كلاسيكي حيث يسعى محرك السوق لمسح تجمعات مؤسسية محددة.
- تأثير المغناطيس: دفع السعر صعودًا إلى منطقة مميزة وهو الآن يتجه بقوة نحو خط الأساس الأخضر للرسم على السيولة (DOL) عند 78,848.64.
- محاذاة الاتجاه: نظرًا لأن انحياز HTF الهيكلي هابط، فإن هذا السحب المحلي نحو خط DOL يتماشى تمامًا مع الاتجاه السائد.
- إزالة السيولة: بمجرد أن يستهدف السعر ويزيل السيولة المستقرة عند هذا الخط الأخضر، عادةً ما يراقب المتداولون كسرًا هيكليًا حاسمًا أو استمرارًا عدوانيًا للاتجاه الهبوطي الكلي.
ملاحظة:
- يمكن استخدامه في BTCUSD، XAUUSD، GBPUSD أو أي رمز آخر.
- التحليل أعلاه لـ BTCUSD يعتمد على الرسم البياني LTF 5m (اختيار يدوي للرسم البياني) و HTF 1DAY (معلمة "وضع التداول" للتداول اليومي من القائمة المنسدلة).
- يمكن استخدام المؤشر لـ ("وضع التداول" اختيار المعلمة يتوافق مع الإطار الزمني للانحياز)
- التداول السريع - HTF 15M، (افتراضي)
- التداول اليومي - HTF 1H,
- التداول التأرجحي - HTF 1D,
- تداول الأربع ساعات - HTF 4H
- يمكن استخدام معلمة "إظهار تصحيح التجمع" لإيقاف تشغيل خط تلاقي الهدف الأقل أهمية باستثناء المصنف #1.
- يمكن استخدام معلمة "إظهار لوحة المعلومات" لإيقاف تشغيل اللوحة وإخفائها.
- يمكن تخصيص "اللوحة" بحجم النص، لون النص، وموقع اللوحة (الموضع الأفقي/العمودي).
- موقع خط "مستوى DOL" على محور X (السعر) يشير إلى خط تلاقي الهدف المصنف #1 على محور Y المقابل (الوقت).
الملخص
The indicator outputs a primary Draw on Liquidity (DOL) target line representing the highest-scored liquidity level, along with secondary ranked targets. It provides an on-screen panel displaying higher timeframe (HTF) bias and target metrics, supporting trading styles from scalping to swing trading by referencing appropriate HTFs (e.g., 15-minute for scalping, daily for swing).
Shadeesoflife DOL integrates multi-timeframe analysis, scanning equal highs/lows, fair value gaps, session boundaries, previous day highs/lows, and gaps to assess directional bias and price magnet levels. It calculates a live Probability of Touch (PoT) percentage estimating the likelihood of price reaching each target.
Traders use the indicator to align trades with HTF bias, identify liquidity sweeps on lower timeframes, and set entries and take profit targets at ranked liquidity pools. It supports markets including BTCUSD and XAUUSD and offers customizable display options for target lines and info panels.











![شعار "Smart Money Concepts (SMC) [Iridio Capital]"](https://cdn.ctrader.com/image/webp/b4b5414d-a5ca-44b7-a947-e28eca44a218_61548)