
الوصف
Multi-Timeframe Oscillator Dashboard
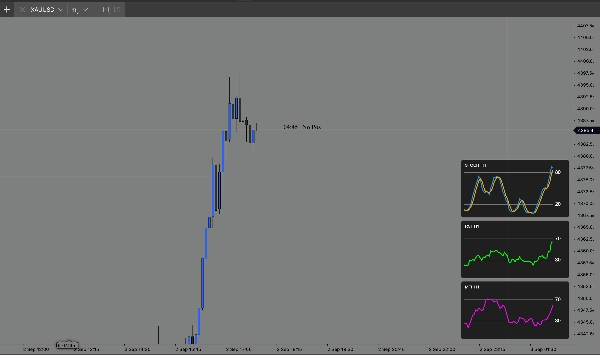
A compact and highly customizable oscillator dashboard designed to keep essential momentum information directly on your main price chart.
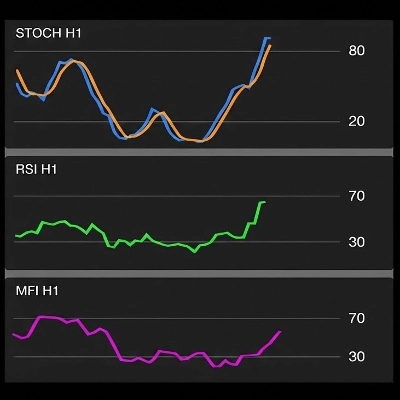
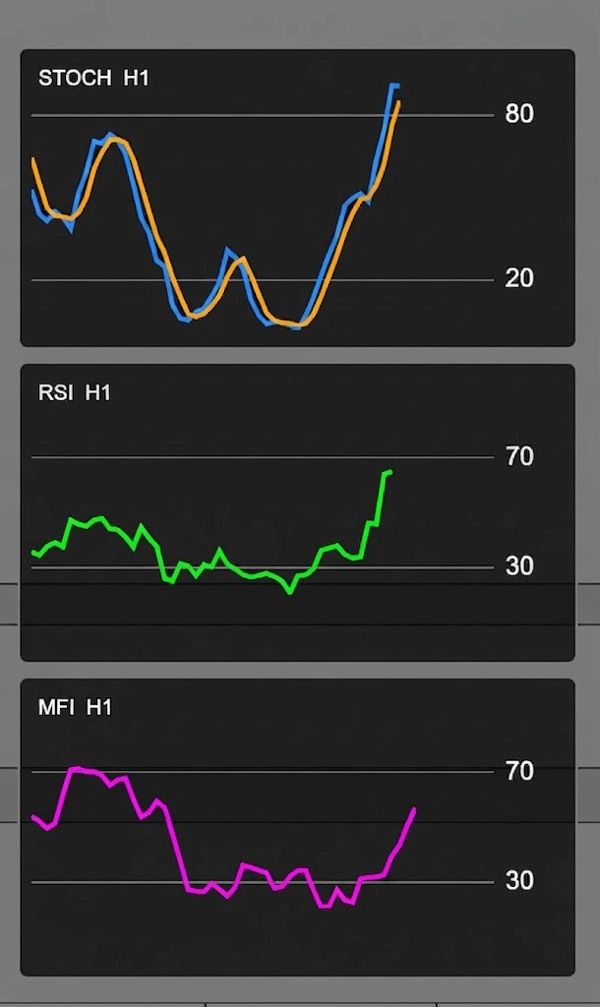
The indicator supports Stochastic, RSI and Money Flow Index (MFI) in separate floating panels. Each oscillator can be enabled or disabled independently, allowing you to display only the information relevant to your trading setup.
Independent Timeframes
Each oscillator can use either the current chart timeframe or its own independently selected timeframe. For example, you can monitor STOCH on H1, RSI on M15 and MFI on H4 while trading from a completely different chart timeframe.
The active timeframe is displayed directly next to each oscillator name, such as STOCH H1, RSI M15 or MFI H4, making multi-timeframe analysis easy to read at a glance.
Customizable Levels
Each oscillator has independent upper and lower reference levels. Default levels are 80/20 for Stochastic and 70/30 for RSI and MFI, while all levels can be adjusted from the indicator settings.
Interactive History
Oscillator panels can be dragged horizontally to inspect previous values without moving the main price chart. Future blank space can also be added to provide additional visual room on the right side of the oscillator.
Flexible Layout & Appearance
Display one, two or all three oscillators simultaneously. Active panels are automatically stacked into a clean compact layout and can be positioned on either side of the chart at the top, center or bottom.
Panel dimensions, spacing, background, opacity, borders, line colors, line thicknesses, level styling, labels and other visual elements can be customized.
Key Features
• Stochastic, RSI and Money Flow Index (MFI)
• Independent ON/OFF control for each oscillator
• Independent timeframe selection for STOCH, RSI and MFI
• Option to automatically use the current chart timeframe
• Active timeframe shown directly in each panel
• Independent upper/lower levels for every oscillator
• Default STOCH levels: 80/20
• Default RSI and MFI levels: 70/30
• Stochastic %K and %D lines
• Horizontal drag for historical inspection
• Configurable future chart space
• Customizable colors and line thicknesses
• Adjustable panel width, height and spacing
• Custom background color and opacity
• Custom border color, thickness and corner radius
• Six chart positioning options
• Compact floating overlay design
This indicator is designed as a visual analysis tool and does not generate trade signals or execute trades automatically.













![شعار "Gaussian Channel [Iridio Capital]"](https://cdn.ctrader.com/image/webp/2c4f9ca9-4e9b-476d-b5a6-787c8095032b_61546)



