
Description
Break Tracer lit la tendance en deux couches et n'agit que lorsqu'elles sont d'accord.
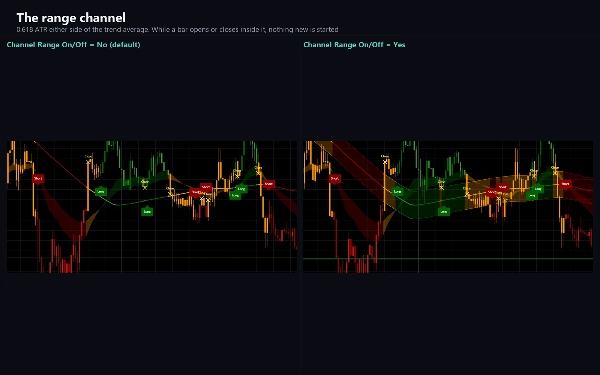
Une paire rapide de moyennes mobiles exponentielles (26 et 50) donne la direction à court terme. Une moyenne de tendance sur 200 barres, avec un canal de 0.618 fois la moyenne de la plage vraie autour, donne la tendance. Lorsque la paire rapide pointe vers le haut et que le prix est au-dessus de la moyenne de tendance, la tendance est haussière ; lorsque les deux pointent vers le bas, elle est baissière ; et tant qu'une barre s'ouvre ou se ferme à l'intérieur du canal, le marché est considéré comme en range et rien de nouveau n'est lancé.
CE QUE VOUS VOYEZ
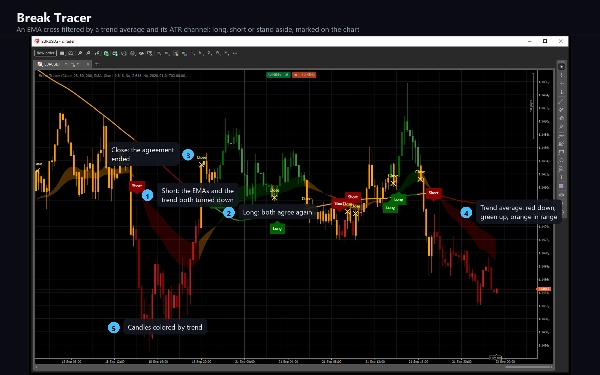
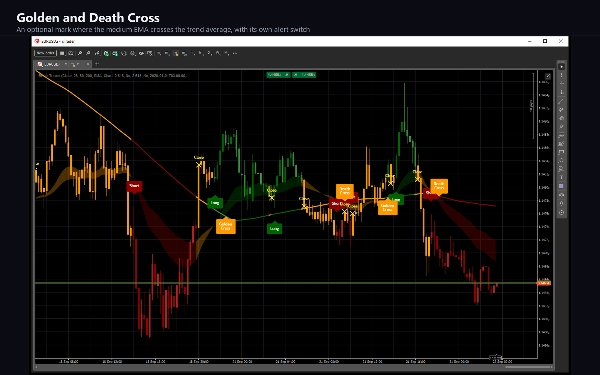
Une ligne de tendance en nuances de vert ou de rouge, orange lorsque le marché est en range.
Une bande ombrée entre les deux moyennes rapides, dans les mêmes couleurs.
Une plaque Long sous la barre où une tendance haussière commence et une plaque Short au-dessus de la barre où une tendance baissière commence.
Une croix jaune où une position est clôturée parce que la tendance ou les moyennes rapides ont tourné.
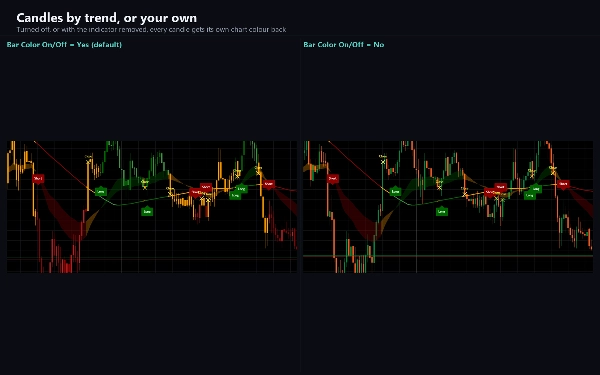
Des chandeliers colorés selon la tendance, avec une teinte plus claire pour un chandelier qui clôture à contre-tendance.
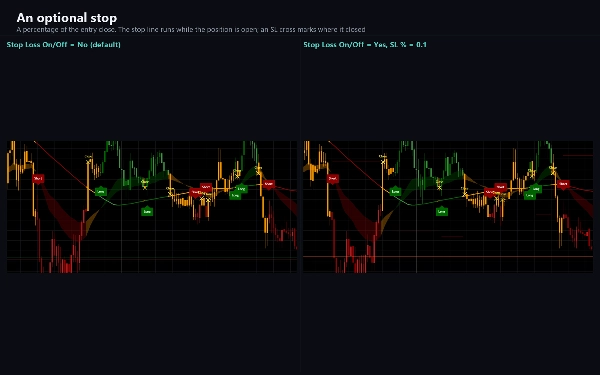
Optionnel : le canal lui-même, une ligne de stop avec une croix SL au niveau qui a clôturé la position, des plaques Golden Cross et Death Cross lorsque la moyenne moyenne croise la moyenne de tendance, et une ombre grise en dehors d'une fenêtre de date de votre choix.
COMMENT L'UTILISER
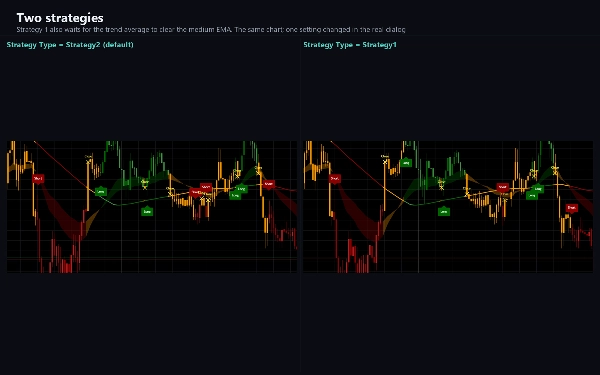
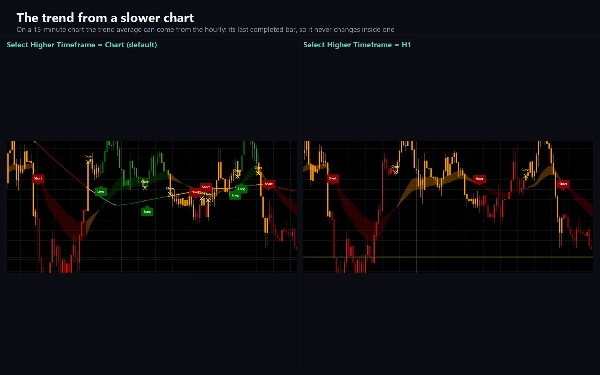
Une plaque Long ou Short marque le moment où les deux couches sont d'accord ; la croix de clôture marque le moment où elles cessent de l'être. La stratégie 2, par défaut, prend chaque accord ; la stratégie 1 est plus stricte et reste à l'écart tant que la moyenne de tendance est encore du mauvais côté de la moyenne moyenne. On peut choisir Long uniquement, Short uniquement ou les deux. La moyenne de tendance peut être prise d'un timeframe supérieur - par exemple l'heure sur un graphique de cinq minutes - et elle utilise alors la dernière barre complétée du timeframe supérieur, donc elle ne change jamais à l'intérieur de cette barre.
PARAMÈTRES
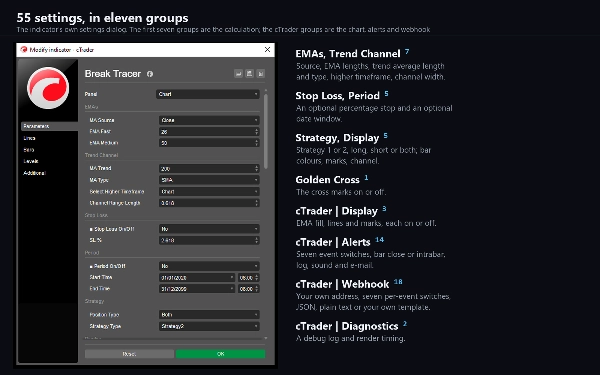
Source, longueurs des EMA, longueur et type de moyenne de tendance (SMA ou EMA), le timeframe supérieur, la largeur du canal, un stop en pourcentage optionnel, une fenêtre de date optionnelle, le type de stratégie et les côtés à prendre. Chaque élément graphique a son propre interrupteur, et désactiver un seul change uniquement le dessin : les valeurs, alertes et webhook continuent.
ALERTES ET WEBHOOK
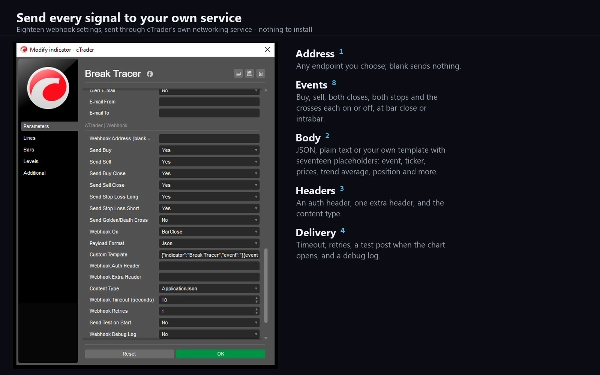
Six événements : Achat, Vente, Clôture Achat, Clôture Vente, Stop Loss Long et Stop Loss Short, plus Golden et Death Cross en option. Chacun a son propre interrupteur et peut se déclencher à la clôture de la barre ou dès que la condition est remplie. La livraison peut être une ligne de journal, un son ou un e-mail. Il y a aussi un webhook : entrez une adresse et chaque événement y est posté en JSON, en texte brut, ou dans un modèle que vous écrivez vous-même avec des espaces réservés pour le symbole, le timeframe, l'heure, les prix, les moyennes, l'état de la tendance et la position. Il reste désactivé jusqu'à ce que vous en saisissiez un, il n'envoie rien pendant le passage historique ou en backtest, et il ne nécessite aucun droit d'accès spécial - les posts sortent via le service réseau propre à cTrader.
POUR LES cBOTS
La moyenne de tendance, les deux moyennes rapides, l'état de la tendance et l'état de la position sont publiés comme séries de sortie.
TYPE ET FENÊTRE
Un indicateur de tendance, dessiné sur le graphique des prix.
TIMEFRAMES ET INSTRUMENTS
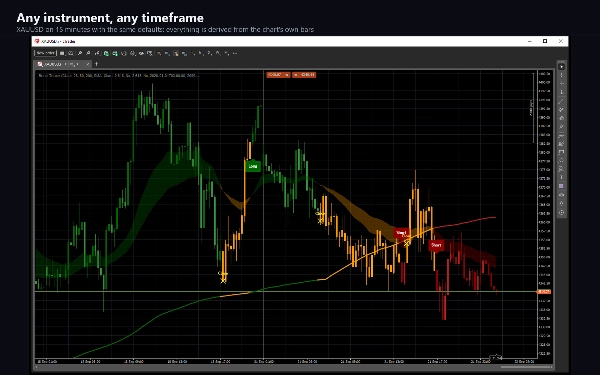
Tout timeframe basé sur le temps ; les valeurs par défaut fonctionnent bien de M5 à H4, et l'option de timeframe supérieur permet à un graphique de timeframe bas de suivre une tendance plus lente. Il fonctionne sur n'importe quel instrument - paires forex, métaux, indices et crypto - car tout ce qu'il utilise est dérivé des barres elles-mêmes.
À QUI IL S'ADRESSE
Aux traders qui veulent un filtre de tendance visible : quand être long, quand être short, quand rester à l'écart, et une alerte à chaque changement.
REMARQUES
Les marques suivent la barre qui est encore en formation, donc une peut apparaître et disparaître jusqu'à la clôture de cette barre. Les alertes et les posts webhook sont par défaut à la clôture de la barre, où la condition est finale. Sur un graphique neuf, la première marque est un Short sur la deuxième barre, car rien ne peut être mesuré tant que les moyennes n'existent pas.
Le trading comporte des risques. Les performances passées ne garantissent pas les résultats futurs.
Résumé
Visual elements include a color-coded trend line (green/red for trend, orange for range), shaded bands between fast EMAs, Long and Short plates marking trend starts, yellow crosses indicating position closes, and candles colored by trend strength. Optional features include the ATR channel display, stop lines with stop-loss crosses, Golden and Death Cross plates, and customizable date window shading.
Break Tracer supports configurable strategies for trade entries and exits, higher timeframe trend averaging, and selective long/short signals. It provides six alert events (Buy, Sell, Close, Stop Loss, Golden/Death Cross) with customizable delivery via log, sound, email, or webhook posting JSON or templated messages. Output series for cBots include trend averages and position states. Settings allow adjustment of sources, lengths, channel width, stop percentages, and visual elements independently.
Avis clients
5 | 100 % | |
4 | 0 % | |
3 | 0 % | |
2 | 0 % | |
1 | 0 % |





















![Logo de "[Stellar Strategies] Smart ADX"](https://cdn.ctrader.com/image/webp/af13b084-b6f6-41db-b7bc-c7e688b57b05_36929)