


الوصف
لا يخبرك Hyper Trend PRO فقط بأن الاتجاه قد تغير. بل يخبرك بمدى اتفاق بقية الرسم البياني.
كيف يتم إنشاء الإشارة
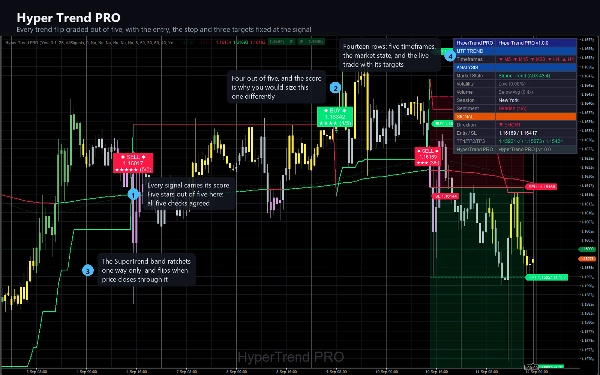
يحدد SuperTrend المبني على متوسط النطاق الحقيقي الاتجاه. توضع الأشرطة فوق وأسفل السعر بمضاعف من ATR لمدة 25 شريطًا، كل شريط يتحرك في اتجاه واحد فقط، ويتغير الاتجاه عندما يغلق السعر من خلال الشريط على الجانب البعيد. تبدأ كل إشارة كواحدة من تلك التغيرات ولا ينشئ أي شيء آخر إشارة.
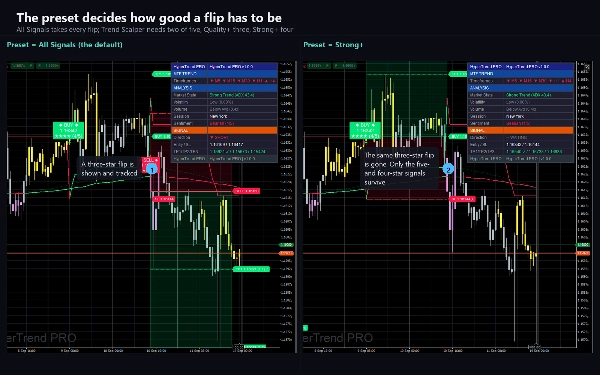
ثم يتم تقييم التغير من خمسة. تصوت خمسة عوامل مستقلة:
- مخطط MACD، يرتفع أو ينخفض مقابل الشريط السابق
- EMA لفترة 150 مقابل EMA لفترة 250
- ADX فوق 20، لذا يتم تصنيف التغير داخل نطاق ميت كواحد
- الحجم مقابل متوسطه لمدة 20 شريطًا
- ميل المتوسط المتحرك Hull لفترة 55
يتم رسم النتيجة على الإشارة كنجمات ورقم من خمسة، وتسمي على التنبيه كضعيف، معتدل أو قوي. الفرق هو بين تغير يتفق معه أربعة مقاييس أخرى وتغير يقف بمفرده.
اختيار مدى انتقائيته
يحدد إعداد مسبق الحد الأدنى للنقاط التي يجب أن يكسبها التغير: كل الإشارات تأخذ كل شيء، Trend Scalper يحتاج إلى اثنين، Quality+ يحتاج إلى ثلاثة وStrong+ يحتاج إلى أربعة. يمكن لستة عوامل تصفية إضافية أن ترفض إشارة بمفردها: الأسواق المتجهة فقط، الدرجات القوية فقط، الحجم فوق المتوسط فقط، التوافق مع السحابة فقط، ووضع معارض يأخذ التغير فقط عندما يكون RSI المملس مشدودًا بالفعل في الاتجاه المعاكس. كل واحد منهم مغلق حتى تقوم بتشغيله.
التداول الذي يرسمه
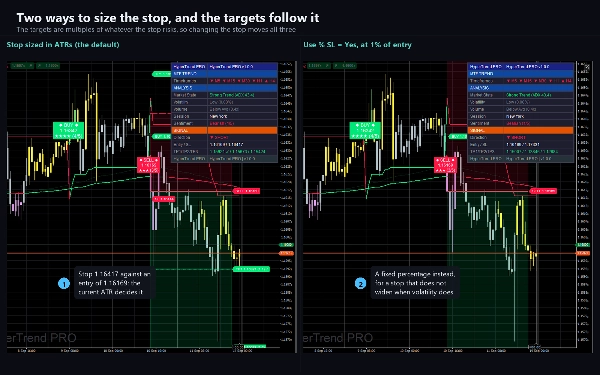
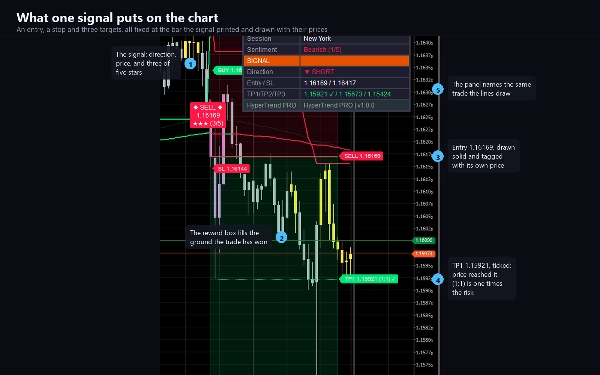
في اللحظة التي تظهر فيها إشارة، يحدد المؤشر دخولًا، وقف خسارة وثلاثة أهداف ويرسم كل واحد كخط معنّون يحمل سعره.
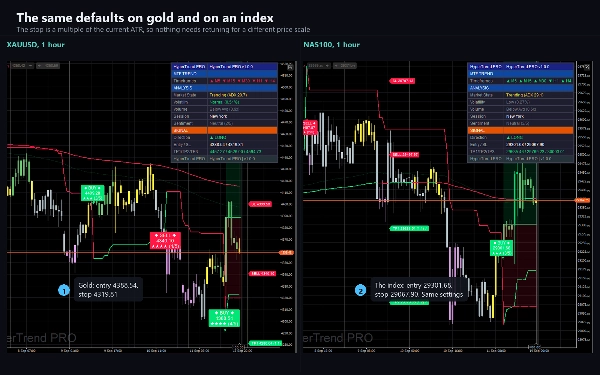
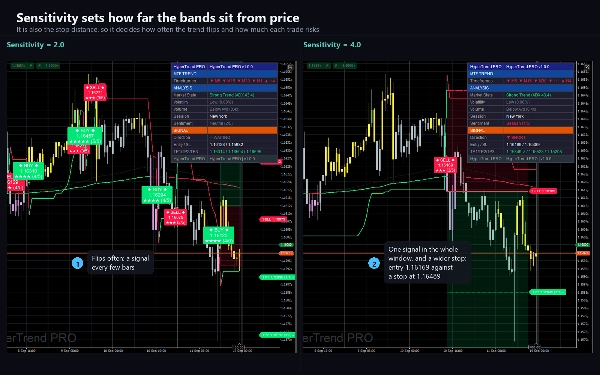
- الوقف هو مضاعف لـ ATR الحالي، لذا فإن نفس الإعدادات تتصرف بشكل معقول على مخطط خمس دقائق وعلى مخطط يومي، وعلى زوج عملات وعلى الذهب. يتوفر وقف نسبة ثابتة بدلاً من ذلك.
- الأهداف الثلاثة هي مضاعفات لنفس المخاطرة، لذا فإن الإعدادات الافتراضية 1.0، 2.0 و3.0 هي حرفيًا واحد، اثنان وثلاثة أضعاف ما تخاطر به.
- يتم التأشير على كل هدف عند وصول السعر إليه. الوصول إلى الهدف الثالث، أو الوقف، يغلق التداول المتتبع.
- يتم رسم وقف ATR متحرك اختياري خلف تداول مفتوح.
ما هو موجود أيضًا على الرسم البياني
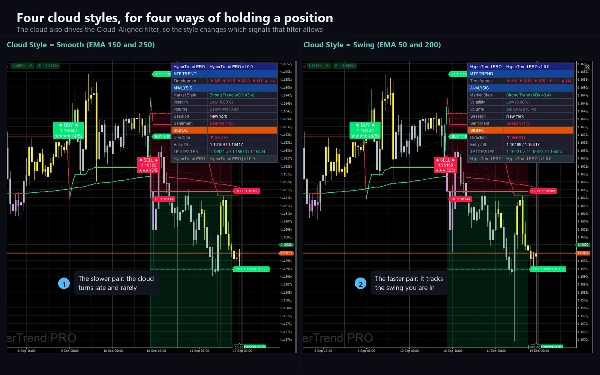
- سحابة بين متوسطين متحركين، بأربعة أنماط: زوج EMA ناعم، نوعان للتقلب السريع وزوج للتأرجح.
- خط Trend Tracer لفترة 250 يتغير لونه مع السعر.
- شموع ملونة عبر ست خطوات حسب قوة مخطط MACD نسبة إلى التقلب، بحيث يكون التحرك الضعيف مرئيًا قبل أن ينقلب. إعداد تلوين الشموع يبدلها إلى ألوان الاتجاه، يظللها حسب درجة التوافق، أو يتركها كما هي عندما يلون مؤشر آخر الشموع على نفس الرسم البياني.
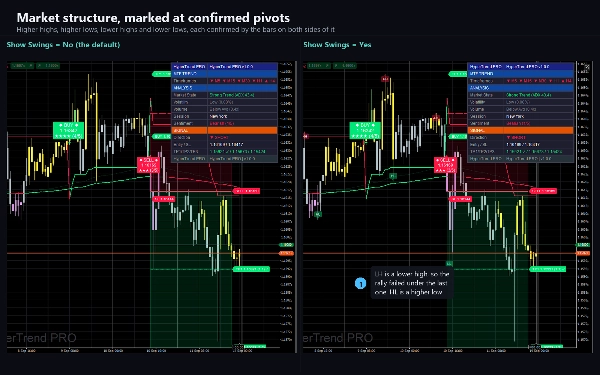
- تسميات هيكل السوق الاختيارية التي تحدد القمم الأعلى، القمم الأدنى، القيعان الأعلى والقيعان الأدنى.
- علامات التراجع الاختيارية من مذبذب WaveTrend، لإعادة الدخول داخل الاتجاه بدلاً من بدايته.
لوحة المعلومات
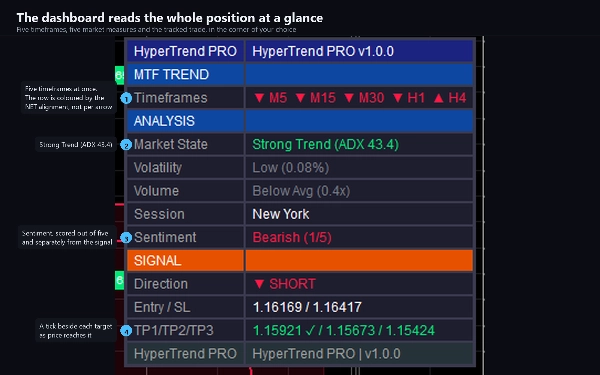
أربعة عشر صفًا في الزاوية التي تختارها. يقرأ المربع العلوي خمسة أطر زمنية مرة واحدة، من M5 إلى H4، ويظهر اتجاه كل منها. تحته: حالة السوق مع ADX الخاص بها، التقلب كنسبة مئوية من السعر، الحجم مقابل متوسطه، جلسة التداول، ودرجة ثانية من خمس نقاط للمزاج العام. المربع السفلي هو آخر إشارة، دخولها ووقفها، وأهدافها الثلاثة مع علامة بجانب كل واحد تم الوصول إليه.
التنبيهات
تسعة أحداث، كل منها خلف مفتاح خاص به: شراء، بيع، أي إشارة، إشارة قوية، الوقف، الأهداف الثلاثة وتغير الاتجاه. كل منها يطلق مرة واحدة لكل شريط مغلق ولا يحدث أبدًا للتاريخ، لذا فإن ربطه بمخطط طويل لا ينتج جدارًا من التنبيهات القديمة. التسليم هو سجل cTrader، صوت اختياري وبريد إلكتروني اختياري من خلال إعدادات cTrader الخاصة بك.
الإعدادات
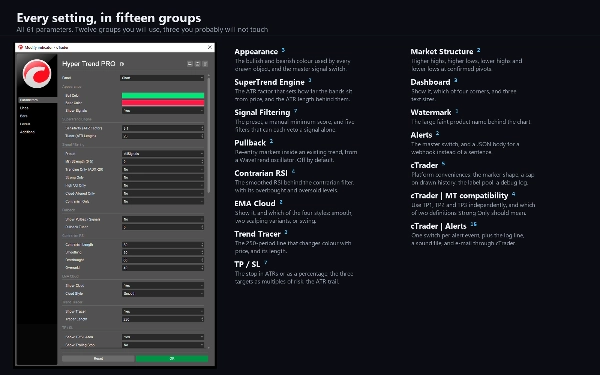
62 معلمة في اثني عشر مجموعة ستستخدمها وثلاثة ربما لن تلمسها. المظهر، محرك SuperTrend، تصفية الإشارة، التراجع، RSI المعارض، السحابة، المتتبع، المخاطرة، هيكل السوق، لوحة المعلومات، العلامة المائية والتنبيهات. الباقي هي تسهيلات cTrader: وضع تلوين الشموع، نمط العلامة، حد الكائن، سجل تصحيح الأخطاء، ثلاثة مفاتيح توافق ومفتاح واحد لكل حدث تنبيه.
النوع، الأطر الزمنية والأدوات
مؤشر تراكبي لتحليل الاتجاه والزخم. أطول متوسط له هو 250 شريطًا، لذا فهو يحتاج إلى مخطط به بعض التاريخ خلفه؛ M15، H1 وH4 هي النافذة التي صُمم حولها، ويعمل على أي إطار زمني. تم التحقق منه على أزواج العملات الرئيسية، على الذهب وعلى المؤشرات. يستخدم الأشرطة والحجم: لا بيانات تيك، لا عمق السوق، لا بيانات خارجية.
لمن هو موجه
المتداولون الذين يريدون إشارة اتجاه تأتي مع درجة بدلاً من نعم أو لا، والذين يريدون تحديد الوقف والأهداف في نفس لحظة الدخول بدلاً من بعدها.
التجربة
نسخة التجربة هي نفس البناء مع قيد واحد: تعمل على EURUSD فقط، وتُقبل لاحقات الوسيط مثل EURUSD.i. لا يوجد حد زمني وكل معلمة متاحة. النسخة الكاملة تضيف كل رمز آخر.
ملاحظات فنية
الإشارات لا تعيد الرسم. يتم تقييمها على الأشرطة المغلقة فقط، لذا لا تظهر علامة خلال شمعة ثم تختفي عند إغلاقها. تكلفة ذلك هي تأخير شريط واحد، وهو مقصود. أثناء فتح تداول، تمتد خطوط مستوياته وتسمياته إلى اليمين مع المخطط، مما يحرك الرسم وليس المستويات.
المؤشر لا يعلن عن حقوق وصول. لا يفتح اتصال شبكة، لا يقرأ ملفًا، ولا يضع أو يعدل أو يغلق أمرًا أبدًا. التيكات على لوحة المعلومات تسجل أن السعر لمس مستوى مرسوم على التاريخ المحمل، بدون سبريد أو عمولة أو انزلاق.
الدعم
تُطرح الأسئلة عبر تبويب النقاش في هذا الإدراج. يرجى تضمين رمزك، الإطار الزمني، الوسيط، نسخة cTrader وصورة شاشة مع لوحة المعلومات ظاهرة.
التداول ينطوي على مخاطر. الأداء السابق لا يضمن النتائج المستقبلية.
الملخص
The indicator fixes entry points, ATR-based stops, and three risk-multiplied targets at the moment a signal occurs, with optional trailing stops. Multiple filters allow users to customize signal selectivity, including trend strength, volume, cloud alignment, and contrarian RSI conditions.
Additional chart features include a configurable cloud between moving averages, a 250-period Trend Tracer line, candle tinting based on MACD strength, market structure labels, and pullback markers from a WaveTrend oscillator. A dashboard displays multi-timeframe trend direction, market state, volatility, volume, session info, sentiment scores, and trade progress.
Hyper Trend PRO supports major currency pairs, gold, and indices, using bar and volume data without tick or external inputs. Alerts cover nine event types with controlled delivery. The indicator does not repaint and operates with a one-bar delay for signal confirmation. It requires no special access rights or order execution capabilities.




























