


الوصف
محرك FXB Confluence هو مؤشر اتجاه وإشارة يقيم عشرة شروط مستقلة على كل شريط مغلق ويظهر لك بالضبط كيف وصل إلى الرقم.
ما يرسمه
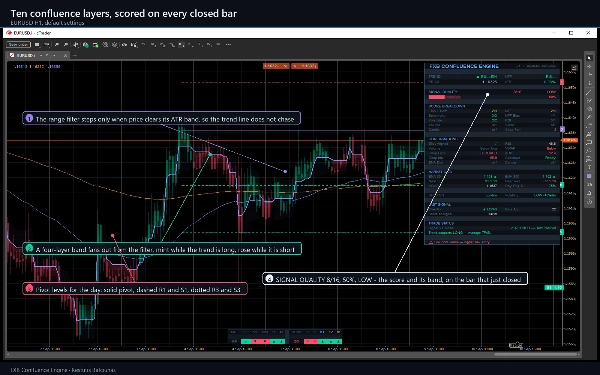
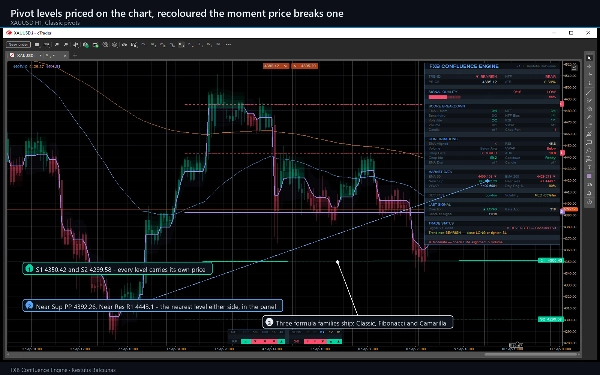
خط اتجاه بفلتر نطاق يتحرك فقط عندما يتجاوز السعر نطاق ATR الخاص به، لذا فهو لا يلاحق السعر. شريط تدرج رباعي الطبقات حوله، ملون باتجاه الترند. علامات شراء وبيع على الأشرطة المغلقة. مستويات محورية للفترة التي تختارها، كل منها مسعر على الرسم البياني ويعاد تلوينه فور كسر السعر لأحدها. متوسطان متحركان أسيان مع أسهم ميل. ولوحة تحكم بأربعة أعمدة وهي نقطة المنتج.
الطبقات العشر
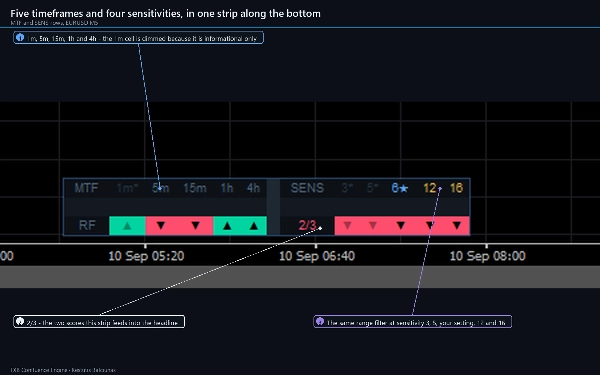
التحيز في إطار زمني أعلى. اتفاق متعدد الأطر الزمنية عبر 5 دقائق، 15 دقيقة، ساعة واحدة و4 ساعات. فحص حساسية متقاطع يشغل نفس الفلتر في ثلاث إعدادات أخرى. توافق المتوسط المتحرك الأسي والزخم عبر ثلاث فترات مراجعة. ترتيب وتقسيم التقلب. مؤشر القوة النسبية. الحجم مقابل المتوسط الخاص به. VWAP. هيكل الشمعة. وأقلها عقوبة مضادة للتقلب.
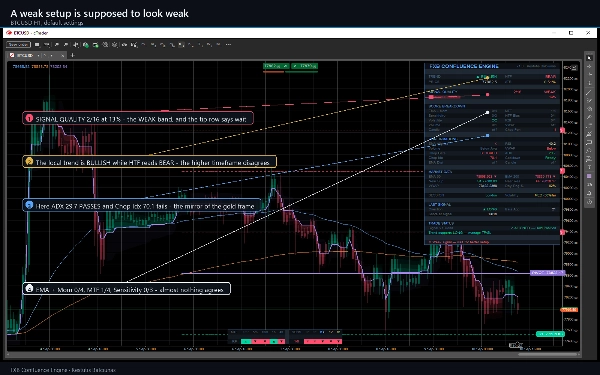
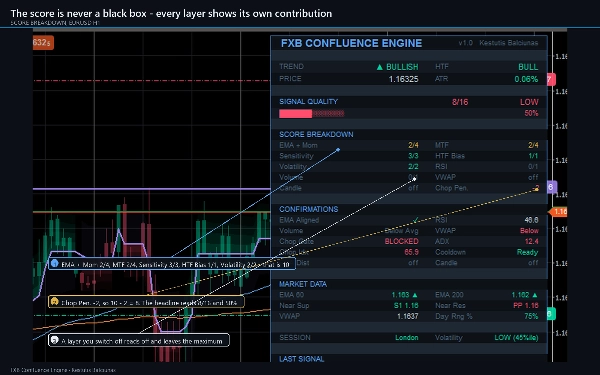
تساهم كل طبقة بدرجة محدودة، وتطبع لوحة التحكم كل واحدة منها بشكل منفصل. عندما يظهر العنوان 8/16 يمكنك رؤية أي خمس طبقات اتفقت، وأي ثلاث لم تفعل، وما كانت العقوبة. الطبقة التي تقوم بإيقافها تظهر "off" وتترك الحد الأقصى، لذا يتبع المقام إعداداتك.
بوابة مضادة للتقلب
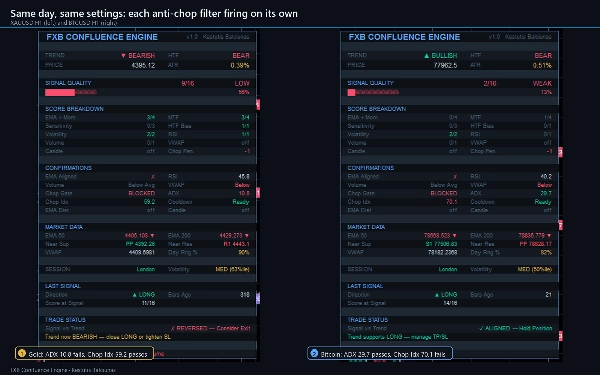
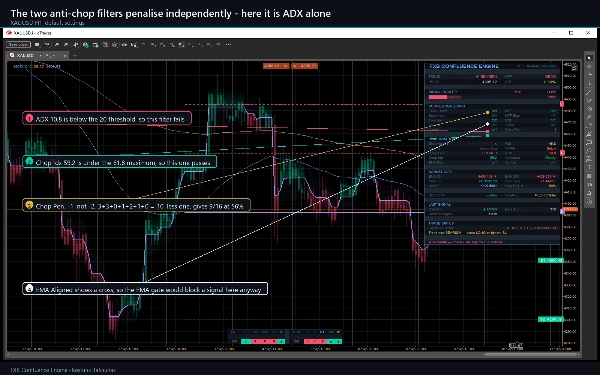
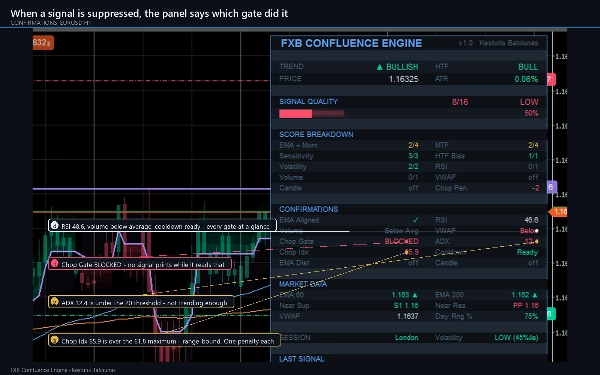
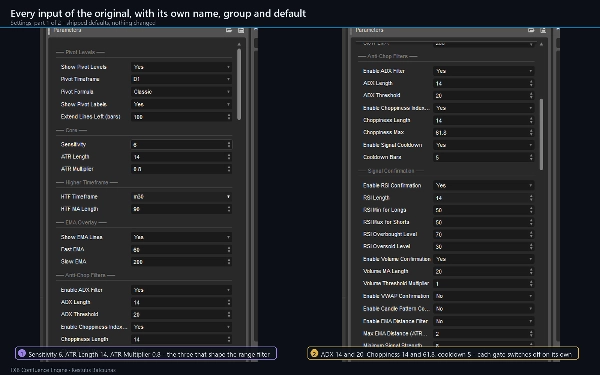
فلتران مستقلان يقرران ما إذا كانت الإشارة مسموح بها على الإطلاق: ADX لقوة الاتجاه ومؤشر التقلب للحالات المحصورة ضمن نطاق، بالإضافة إلى فترة تبريد تمنع إطلاق إشارة خاطئة مرتين. كل فلتر يفشل يكلف نقطة واحدة وتذكرها لوحة التحكم، لذا فإن الإشارة المكبوتة ليست لغزاً أبداً - صفوف ADX وChop Idx تخبرك أيهما يغلق البوابة.
إعادة التلوين
يتم حساب الإشارات على الأشرطة المغلقة ولا تعيد التلوين. خط الاتجاه، الشريط، لون الخلفية وتلوين الشريط يتبعون عمداً الشريط الحي ويتحركون بداخله. الأسهم والدرجة لا تفعلان ذلك.
التنبيهات
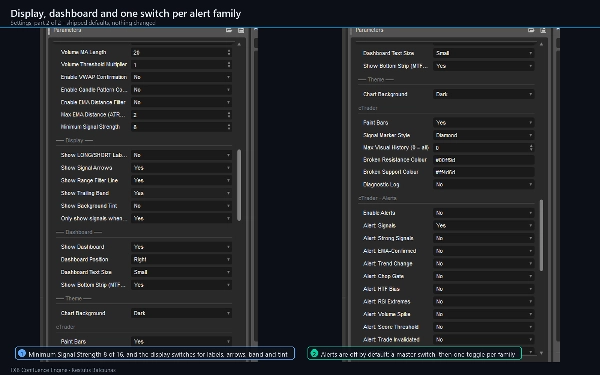
عشر عائلات تنبيه تغطي تسعة عشر شرطاً: إشارات، إشارات قوية، إشارات مؤكدة بالمتوسط المتحرك الأسي، تغييرات الاتجاه، انتقالات بوابة التقلب، تقلبات التحيز في إطار زمني أعلى، أقصى قيم مؤشر القوة النسبية، ارتفاعات الحجم، عبور عتبة الدرجة وإبطال التداول. كلها مغلقة افتراضياً، كلها على الأشرطة المغلقة فقط، كلها مكررة لكل شريط، ولا يطلق أي منها أثناء تحميل المؤشر للتاريخ.
نوع المؤشر والنافذة
مؤشر تراكبي: يرسم على مخطط السعر، وليس في لوحة منفصلة.
الأطر الزمنية والأدوات الموصى بها
مصمم ومختبر من دقيقة واحدة إلى يومي، مع 5 دقائق، 15 دقيقة، ساعة واحدة و4 ساعات الأكثر فائدة في الإعدادات الافتراضية. يعمل دون تغيير على العملات الرئيسية والمتقاطعة، الذهب والفضة، المؤشرات، العملات الرقمية والأسهم الأكبر.
لمن هو
للمتداولين الذين يريدون رأياً ثانياً قبل اتخاذ إعداد، والذين يفضلون رؤية سبب رفض الإشارة بدلاً من عرض سهم فارغ. يناسب المتداولين التقديريين الذين يقرؤون الهيكل، وأي شخص يريد فحص متعدد الأطر الزمنية دون تكديس ستة مخططات.
ما لا يفعله
لا يضع أوامر ولا يدير مراكز. ليس لديه حقوق وصول: يقرأ بيانات السوق ويرسم. هو أداة تحليل وتنبيه، وكل قرار يبقى لك.
الإعدادات
65 معلمة في تسع مجموعات، كلها موثقة، مع إعدادات افتراضية معقولة يمكنك تركها كما هي. التكوين المرفق هو المقصود.
المتطلبات
cTrader 5.9 أو أحدث، أي وسيط. طبقات الحجم وVWAP تحتاج إلى تغذية تحمل الحجم؛ الطبقات الثمانية الأخرى تعمل على أي تغذية.
التجربة
نسخة تجريبية مرفقة مع هذا المنتج. هي المؤشر الكامل مع قيد واحد: يعمل على EURUSD فقط، مع قبول أي لاحقة للوسيط. لا يوجد حد زمني ولا يتم إزالة أي ميزة. النسخة الكاملة تزيل قيد الرمز، وهذا هو الفرق الوحيد بينهما.
الدعم
استخدم تبويب النقاش. يرجى تضمين وسيطك، الرمز، الإطار الزمني، نسخة cTrader وصورة شاشة تظهر لوحة التحكم - فهي تعرض حالة كل بوابة وعادة ما تجيب على السؤال بنفسها.
التداول ينطوي على مخاطر. الأداء السابق لا يضمن النتائج المستقبلية.
الملخص
The indicator visually presents a range-filter trend line that moves only when price clears its ATR band, surrounded by a four-layer gradient band colored by trend direction. It also plots pivot levels for user-selected periods, two EMAs with slope arrows, and buy/sell markers on closed bars. A four-column live dashboard displays the individual scores of each layer and identifies which conditions contribute to the overall signal, including any anti-chop gate filters based on ADX and Choppiness Index.
Signals and alerts cover nineteen conditions such as trend changes, strong signals, RSI extremes, and volume spikes, all triggered on closed bars without repainting. The indicator supports forex majors and crosses, gold, silver, indices, crypto, and larger stocks, with recommended timeframes from 1-minute to daily, especially 5m to 4h. It includes 65 configurable parameters grouped into nine sections, allowing customization while maintaining documented defaults. The product does not execute trades or manage positions; it serves as an analytical and alerting tool.
مناقشة
تقييمات العملاء
5 | 100 % | |
4 | 0 % | |
3 | 0 % | |
2 | 0 % | |
1 | 0 % |




























![شعار "[Hamster-Coder] Pivot Points MTF"](https://cdn.ctrader.com/image/webp/4c143e5a-309c-40e3-a578-f04d1e133ffa_31159)
