Opis
Wstęgi VWAP
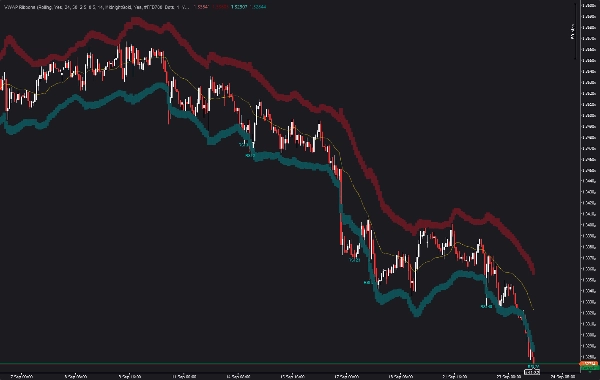
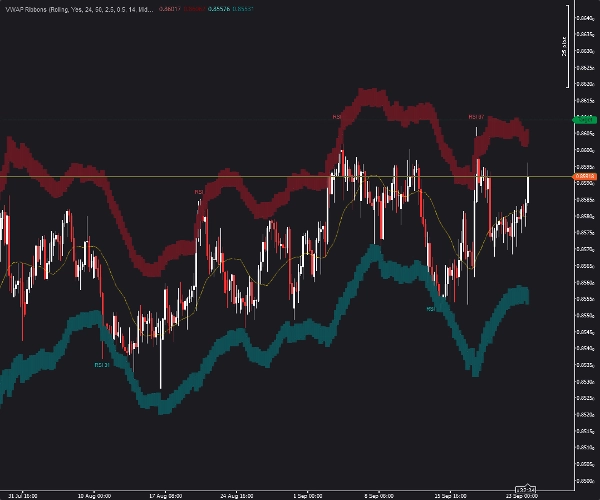
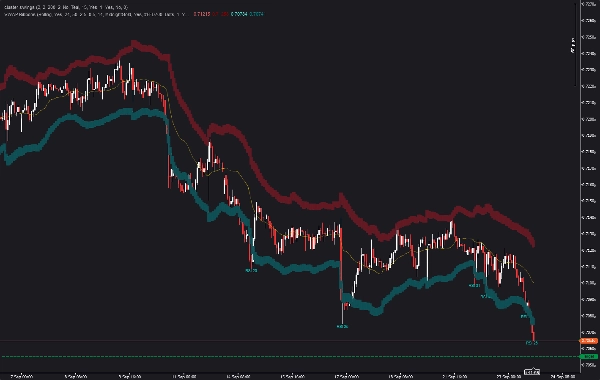
VWAP + dwuwarstwowe wstęgi ATR z etykietami RSI na ekstremach wybicia — na żywo etykiety formujące się na tickach w cTrader
Wstęgi VWAP to wskaźnik cTrader, który rysuje linię bazową średniej ważonej wolumenem (rolling lub dzienną), otacza ją dwuwarstwowymi wstęgami zmienności ATR i automatycznie oznacza wartość RSI przy każdym zakończonym ekstremum wybicia — w tym etykietę na żywo aktualizowaną na aktualnie formującym się słupku, gdy cena przesuwa się do nowego ekstremum.
Stworzony dla traderów, którzy chcą czysty kontekst zmienności wokół VWAP bez bałaganu, plus kontekst RSI dokładnie na słupku, gdzie cena wysunęła się poza zewnętrzną wstęgę.
Natywny cTrader • Bez przemalowywania na zakończonych słupkach • Na żywo etykiety formujące się na tickach • Pięć gotowych motywów
Co robi wskaźnik
Wstęgi VWAP odpowiadają na jedno podstawowe pytanie:
Gdzie cena handluje względem ważonej wolumenem wartości godziwej — i jak bardzo jest rozciągnięty obecny ruch?
Wskaźnik wyświetla:
- Linię bazową VWAP (okno kroczące lub reset dzienny)
- Wewnętrzną wstęgę ATR (wielokrotność k)
- Zewnętrzną wstęgę ATR (wielokrotność k + krok)
- Opcjonalne cieniowanie wstęgi między wewnętrzną a zewnętrzną
- Etykiety RSI przy każdym zakończonym ekstremum wybicia
- Na żywo etykieta RSI śledząca aktualnie formujące się wybicie
Wybicia definiuje się jako każdy słupek, którego maksimum dotyka lub przekracza zewnętrzną górną wstęgę (lub minimum dotyka/przekracza zewnętrzną dolną wstęgę), z etykietą zakotwiczoną do ekstremalnego słupka tej eskursji — nie do słupka wejścia ani wyjścia.
Główne składniki
Linia bazowa VWAP
Dostępne dwa tryby:
- Okno kroczące — ciągle aktualizowany VWAP z ostatnich N słupków. Tryb automatyczny wyznacza liczbę słupków na podstawie ramy czasowej (domyślnie 24 godziny danych). Tryb ręczny pozwala określić liczbę słupków bezpośrednio.
- Reset dzienny — VWAP resetuje się na początku każdego dnia handlowego.
Dwuwarstwowe wstęgi ATR
Wewnętrzne i zewnętrzne wstęgi zmienności rysowane wokół linii bazowej VWAP przy użyciu Average True Range (wygładzanie Wildera, aby dopasować do MetaTradera). Wstęga wewnętrzna znajduje się na poziomie k × ATR; wstęga zewnętrzna na poziomie (k + krok) × ATR. Wstęgi naturalnie rozszerzają się i kurczą wraz ze zmiennością.
Cieniowanie wstęgi
Opcjonalne półprzezroczyste wypełnienie między wewnętrzną a zewnętrzną wstęgą, tworzące wizualny kanał. Przezroczystość jest konfigurowalna. Rysowanie wstęgi ograniczone jest limitem cofania, aby utrzymać płynność działania na długich historiach.
Etykiety RSI na zakończonych wybiciach
Każde zakończone ekstremum wybicia otrzymuje etykietę RSI. Etykieta jest zakotwiczona do maksimum ekstremalnego słupka (dla wybicia górnego) lub minimum (dla wybicia dolnego), przesunięta o konfigurowalną odległość ATR. Etykieta pokazuje wartość RSI na tym słupku.
Na żywo formujące się etykiety wybicia
Dedykowana etykieta na żywo śledzi wybicie aktualnie formującego się słupka w czasie rzeczywistym. Gdy cena przesuwa się do nowego ekstremum na formującej się świecy, etykieta podąża za tym ruchem. Po zamknięciu słupka etykieta na żywo przechodzi do listy potwierdzonych etykiet wybicia.
Jak to działa
- VWAP jest obliczany na wybranym okresie cofania za pomocą typowej ceny × wolumen ÷ całkowity wolumen. Tablice sum skumulowanych zapewniają dokładny koszt O(1) na słupek niezależnie od rozmiaru okna.
- ATR (wygładzanie Wildera) jest obliczany dla skonfigurowanego okresu. Wewnętrzne i zewnętrzne wstęgi są rysowane na poziomach
kik + krokpowyżej i poniżej linii bazowej VWAP. - Maszyna stanów śledzi górne i dolne eskursje:
-
- Eskursja zaczyna się, gdy cena dotyka lub przekracza zewnętrzną wstęgę.
- Ekstremalny słupek i ekstremalna cena są aktualizowane, gdy cena przesuwa się dalej.
- Eskursja kończy się, gdy cena zamyka się z powrotem wewnątrz wewnętrznej wstęgi.
- Ekstremalny słupek jest zapisywany jako zakończone wybicie.
- Etykiety RSI są rysowane na ekstremalnym słupku każdego zakończonego wybicia.
- Na żywo utrzymywana jest etykieta na aktualnie formującym się słupku, aktualizowana przy każdym ticku aż do zamknięcia słupka.
Co widzisz na wykresie
- Linia VWAP (niestandardowy kolor, styl i szerokość piksela)
- Cztery linie graniczne wstęg (wewnętrzna kropkowana, zewnętrzna ciągła — górna i dolna)
- Opcjonalne cieniowanie wstęgi między wewnętrzną a zewnętrzną
- Etykiety RSI nad górnymi ekstremami wybicia (pokazujące RSI na tym słupku)
- Etykiety RSI pod dolnymi ekstremami wybicia (pokazujące RSI na tym słupku)
- Na żywo etykieta RSI śledząca aktualne formujące się wybicie
Pięć gotowych motywów:
Midnight Gold · Neon · Ocean · Light Chart · Custom
Zachowanie historyczne, na żywo i bez przemalowywania
Wszystkie obliczenia zakończonych wybicia wykorzystują tylko zamknięte słupki. Po zamknięciu słupka i zarejestrowaniu ekstremum wybicia etykieta nie zmienia się.
Etykieta na żywo formującego się wybicia aktualizuje się tick po ticku w miarę rozwoju aktualnego słupka — jest to odczyt tymczasowy i nie jest ostateczny, dopóki słupek się nie zamknie. Po zamknięciu słupka eskursja jest albo potwierdzana jako zakończone wybicie (i umieszczana jest trwała etykieta), albo odrzucana, jeśli cena zamknęła się z powrotem wewnątrz wewnętrznej wstęgi.
Etykieta na żywo jest wizualnie identyczna z zakończonymi etykietami, ale zawsze odzwierciedla aktualny stan formującego się słupka.
Architektura parametrów
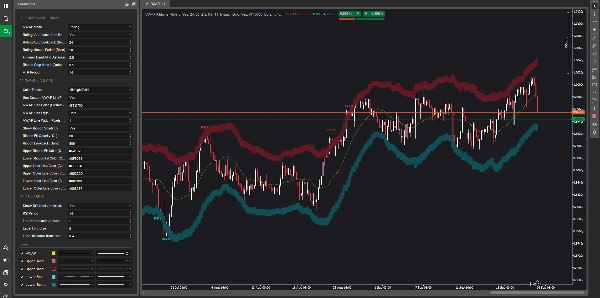
01. Podstawowe — VWAP + wstęgi
Tryb VWAP (kroczący / dzienny) · Automatyczne kroczące (słupki z ramy czasowej) · Cofanie automatyczne kroczące (godziny) · Ręczny okres kroczący (słupki) · k — odległość wewnętrznej wstęgi ATR · Krok wstęgi od k · Okres ATR
02. Motyw + kolory
Gotowy motyw · Przełącznik niestandardowej linii VWAP · Kolor linii VWAP · Styl linii VWAP · Szerokość linii VWAP · Przełącznik cieniowania wstęgi · Przezroczystość wypełnienia wstęgi · Cofanie wstęgi w słupkach · Kolory wypełnienia górnej / dolnej wstęgi · Kolory linii górnej wewnętrznej / zewnętrznej / dolnej wewnętrznej / zewnętrznej
03. Etykiety RSI
Pokaż etykiety RSI · Okres RSI · Ostatnie N wybicia do oznaczenia · Rozmiar czcionki etykiety · Odległość etykiety od ekstremum (× ATR)
Praktyczne scenariusze rynkowe
Cena wykracza poza zewnętrzną wstęgę i zamyka się z powrotem wewnątrz
Cena przebija się przez wewnętrzną i zewnętrzną górną wstęgę, ustanawiając nowe maksimum. Etykieta RSI jest umieszczana na tym ekstremalnym słupku, pokazując odczyt RSI w momencie maksymalnego rozciągnięcia. Jeśli RSI było powyżej 70, etykieta wizualnie sygnalizuje wykupienie przy zewnętrznej wstędze.
Utrzymujący się trend z wieloma wybiciami
Cena powoli rośnie przez wiele słupków, wielokrotnie przesuwając się poza zewnętrzną wstęgę. Każde nowe ekstremum, które zamyka się z powrotem wewnątrz wewnętrznej wstęgi, jest rejestrowane jako osobne zdarzenie wybicia z własną etykietą RSI. Zbiór etykiet szybko pokazuje, czy RSI rośnie, jest płaskie, czy dywerguje na kolejnych ruchach.
Na żywo formujące się wybicie
Cena obecnie naciska na zewnętrzną górną wstęgę. Na żywo etykieta RSI śledzi ekstremum aktualnie formującego się słupka. W miarę rozwoju słupka etykieta aktualizuje się tick po ticku. Gdy słupek zamyka się wewnątrz wewnętrznej wstęgi, etykieta przechodzi do trwałej etykiety zakończonego wybicia.
Kompresja i rozszerzanie wstęgi
Szerokość wstęgi rozszerza się podczas ruchów trendowych i kurczy podczas spokojnych okresów. Gdy wstęga się zwęża, cena często szybko zamyka się z powrotem wewnątrz wewnętrznej wstęgi po dotknięciu zewnętrznej — co wskazuje na płytkie eskursje. Gdy wstęga się rozszerza, eskursje zwykle trwają dłużej.
Kompatybilność
- Platforma: cTrader (API cAlgo)
- Klasy aktywów: Forex, metale w tym XAUUSD, indeksy w tym US30, NAS100 i GER40, surowce oraz instrumenty kryptowalutowe
- Ramki czasowe: M5, M15, H1, H4, dzienne
- Dane wolumenowe: wolumen ticków dostarczany przez brokera
- Zależności: brak. Natywny cAlgo, bez zewnętrznych bibliotek
Uwagi techniczne
Wskaźnik napisany jest w całości w cAlgo (C#). Kroczący VWAP używa tablic sum skumulowanych — koszt na słupek pozostaje stały niezależnie od długości okna. Cała logika zakończonych wybicia wykorzystuje dane z zamkniętych słupków.
Maszyna stanów wybicia śledzi najwyższe maksimum (dla eskursji górnych) lub najniższe minimum (dla eskursji dolnych), dopóki cena pozostaje poza zewnętrzną wstęgą. Zarejestrowany ekstremalny słupek to ten, na którym eskursja osiągnęła maksimum — nie słupek wejścia ani wyjścia.
Etykiety formujące się na żywo są rysowane jako obiekty tekstowe na wykresie z unikalnymi nazwami dla każdego znacznika czasu ekstremum, co zapewnia płynne aktualizacje bez nadmiernego tworzenia obiektów. Zakończone etykiety są śledzone i automatycznie usuwane, gdy wychodzą poza okno "Ostatnie N".
Wypełnienie wstęgi używa prostokątnych obiektów wykresu z automatycznymi pionowymi łącznikami, zapewniającymi płynne cieniowanie między słupkami.
Dla kogo jest ten wskaźnik?
Wstęgi VWAP odpowiadają traderom, którzy chcą:
- Czysty punkt odniesienia VWAP z kontekstem zmienności
- Widoczną wstęgę opartą na ATR do analizy rozciągnięcia
- Odczyty RSI na dokładnym słupku maksymalnego rozciągnięcia ceny
- Na żywo śledzenie aktualnie formującego się wybicia
- Minimalny bałagan na wykresie z konfigurowalnym cofaniem wstęgi
Używaj go razem z szerszymi metodologiami obejmującymi analizę ruchu cen, analizę wolumenu, powrót do średniej lub kontynuację trendu.
Wskaźnik zapewnia wizualizację analityczną — nie jest sygnałem kupna ani sprzedaży.
Zakup
Wstęgi VWAP są dostępne w sklepie cTrader. Twój zakup obejmuje dostęp dożywotni, pięć gotowych motywów oraz bezpośrednie wsparcie dewelopera.
Wstęgi VWAP — wskaźnik VWAP dla cTrader | Kroczący VWAP | Dzienny VWAP | Wstęgi ATR | Wstęga ATR | Wstęga VWAP | Etykiety RSI | Etykiety wybicia | Etykiety formujące się na żywo | wskaźnik cTrader | wskaźnik cAlgo | sygnały bez przemalowywania | średnia ważona wolumenem | wskaźnik XAUUSD | wskaźnik US30 | wskaźnik NAS100 | powrót do średniej | wstęgi zmienności | wykupienie wyprzedanie
Podsumowanie
Key features include customizable VWAP modes, ATR band multipliers, optional shaded ribbons between bands, and configurable RSI label display. Breakouts are identified by excursions beyond the outer bands that close back inside the inner bands, with labels anchored to the extreme bar of each breakout. The indicator supports multiple timeframes (M5 to Daily) and asset classes including Forex, metals (e.g., XAUUSD), indices (e.g., US30, NAS100), commodities, and cryptocurrencies, using broker-supplied tick volume data.
VWAP Ribbons is designed for traders seeking clear volatility and momentum context around VWAP with minimal chart clutter. It provides analytical visualization without generating buy or sell signals. Five theme presets and extensive customization options are included.
























![Logo „[CB] Pivot Points Pro”](https://cdn.ctrader.com/image/webp/43463c82-67b0-4f10-a4ba-901bba091d81_32594)