
Trade Analytics Dashboards
Trade analytics dashboards turn raw history into actionable insights. Review win rate, expectancy, drawdown, and distribution of outcomes, then drill down by symbol, session, or setup. Ideal for optimizing a trading strategy, understanding when a forex robot performs best, and keeping performance transparent across accounts.
Alat
Perbandingan alat
Soalan Lazim
Free and paid trading robots for forex, indices, metals, crypto and other supported markets.


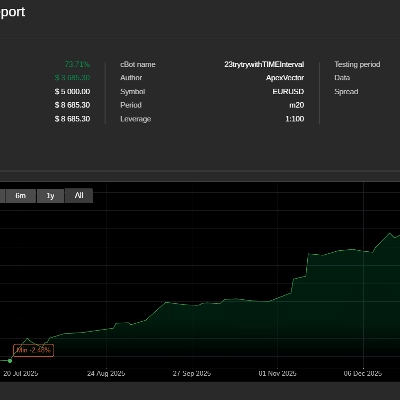
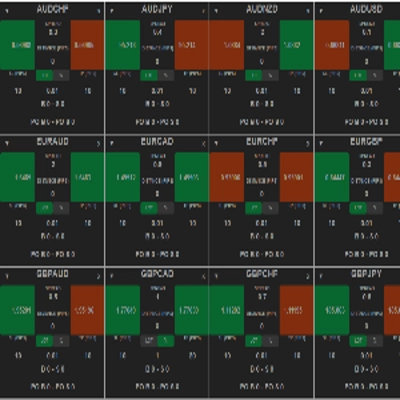

Free and paid technical indicators for analysing forex, indices, metals and other supported markets.

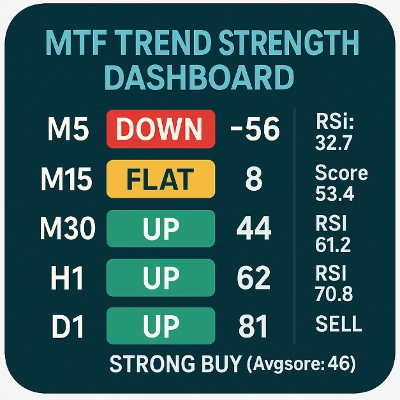
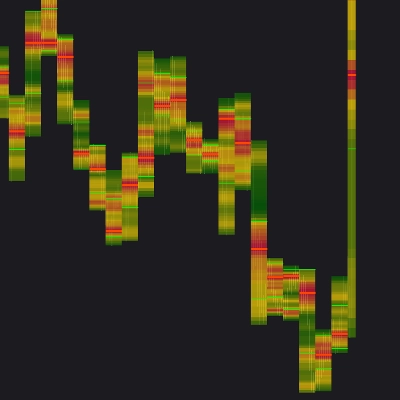
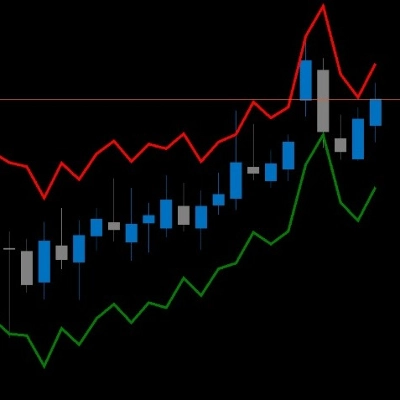
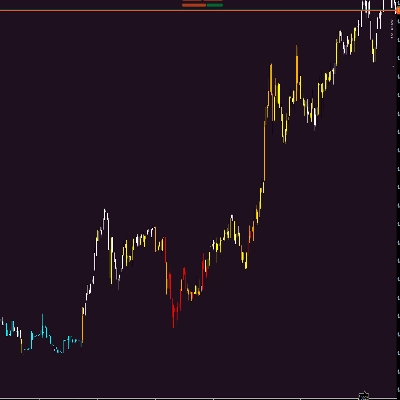

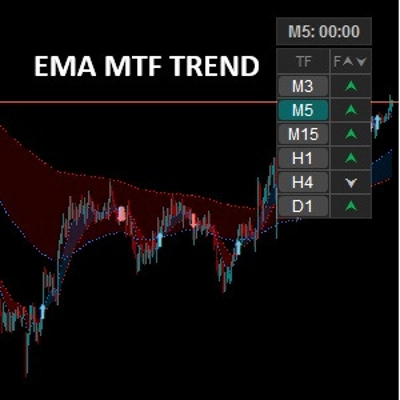



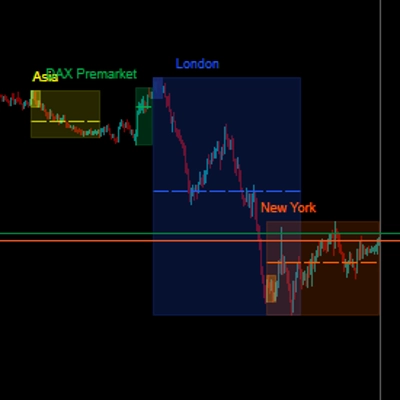
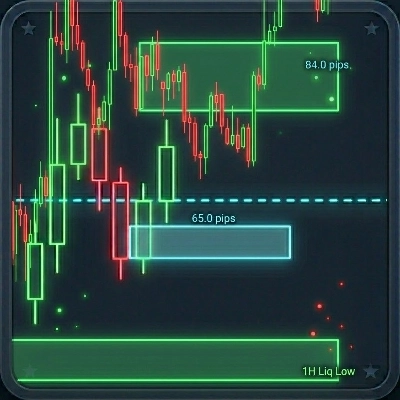
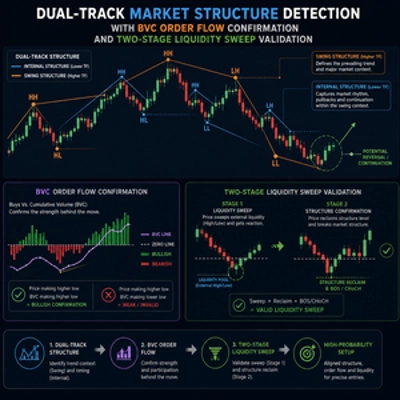


Trading plugins built for cTrader Windows and Mac. Add panels, shortcuts and extra features to your desktop workspace.


Perbandingan alat
Produk | Ulasan | Muat turun | Jualan | Harga | Platform yang serasi |
|---|---|---|---|---|---|
DataWindow | 4.0 (1) | 1.05K | — | Percuma | Windows, Mac |
Samurai Breakout Pro II | 5.0 (4) | — | 25 | dari $9 | Windows, Mac |
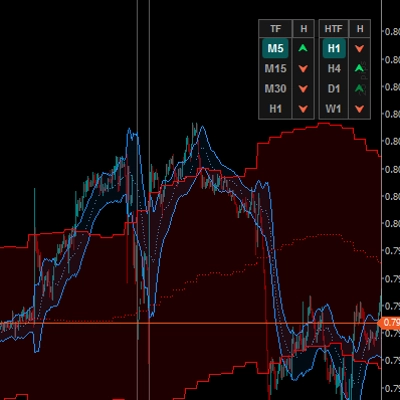
Multi Timeframe Trend Scanner | 4.0 (4) | 959 | — | Percuma | Windows, Mac |
PP. PnL Journal Analytics Dashboard | 4.7 (3) | — | 15 | $39 | Windows, Mac |
VolumeThermometer | — | 499 | — | Percuma | Windows, Mac |
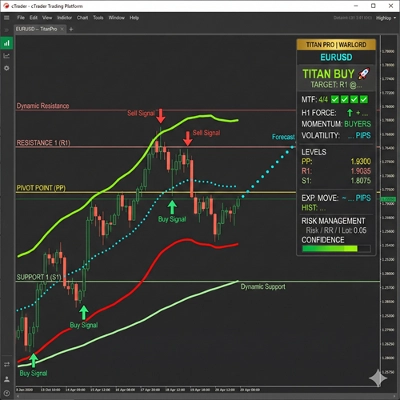
Titan Pro | 4.3 (3) | — | 6 | $19 | Windows, Mac |
Go To Date 1.0 | 3.7 (3) | 459 | — | Percuma | Windows, Mac |
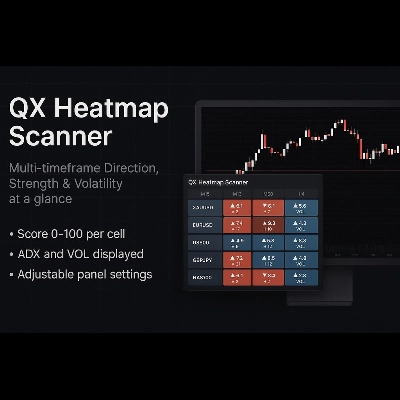
QX Heatmap Scanner | 4.3 (3) | — | 5 | $19 | Windows, Mac |
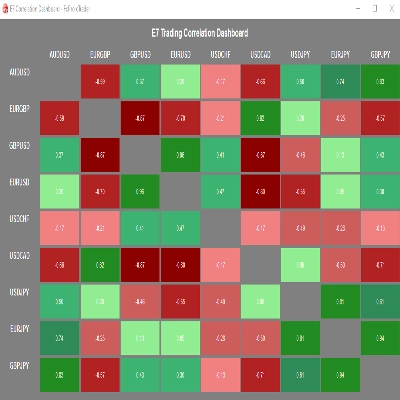
E7 Correlation Dashboard | 5.0 (1) | 447 | — | Percuma | Windows, Mac |
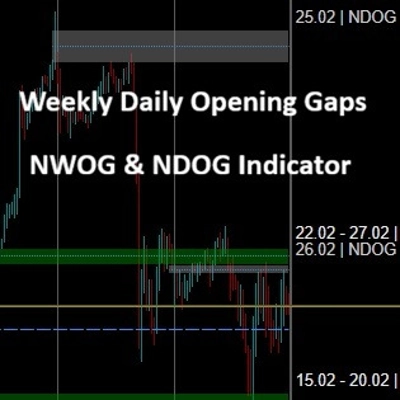
Weekly Opening Gaps | 4.5 (4) | — | 2 | $25 | Windows, Mac |
ATR on Chart | — | 305 | — | Percuma | Windows, Mac |
cPanel 1.1 | 4.5 (2) | — | 2 | $39 | Windows, Mac, Mobile, Web |
HeatMap Candle | — | 161 | — | Percuma | Windows, Mac |
Complete Professional Trading Dashboard | 5.0 (3) | — | 2 | $24 | Windows, Mac |
Kaufman Adaptive MA with Trend Vision | — | 156 | — | Percuma | Windows, Mac |
EMA MTF TREND | 4.5 (2) | — | 2 | $20 | Windows, Mac |
HCCC MTF cbot indicator | — | 141 | — | Percuma | Windows, Mac |
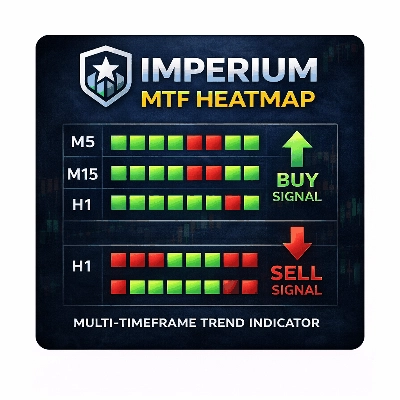
Imperium MTF Heatmap | 4.5 (4) | — | 2 | $99 | Windows, Mac |
MultiMA-display | — | 140 | — | Percuma | Windows, Mac |
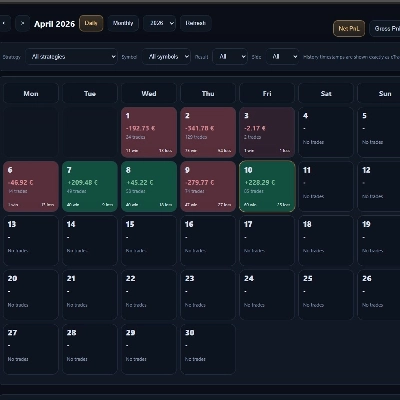
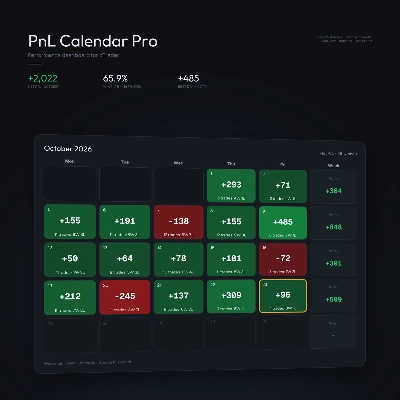
PnL Calendar Pro | — | — | 2 | $29 | Windows, Mac |
Tracking Performance by Quantara | — | 45 | — | Percuma | Windows, Mac |
Edge Matrix Pro | 5.0 (1) | — | 2 | $219 | Windows, Mac, Mobile, Web |
Fixed Volume Profile Pro | — | — | 2 | $30 | Windows, Mac |
Volumatic Fair Value Gaps | 4.3 (3) | — | 2 | $49 | Windows, Mac |
HA | 4.5 (2) | — | 2 | $19 | Windows, Mac |
Support and Resistance Toolkit | 4.0 (1) | — | 1 | $19 | Windows, Mac |
Screener | 4.5 (2) | — | 1 | $35 | Windows, Mac |
KANDIKA HEAT MAP | 4.6 (5) | — | 1 | $19 | Windows, Mac |
Temporal_Volatility_Alpha_forPropFirm | 4.0 (4) | — | 1 | $44 | Windows, Mac, Mobile, Web |
VelaInterna | — | — | 1 | $19 | Windows, Mac |
Sessions PRO | 4.0 (2) | — | 1 | $20 | Windows, Mac |
Liquidity and IFVG | — | — | 1 | $30 | Windows, Mac |
OrderFlow Structure SMC Indicator cTrader | — | — | 1 | $30 | Windows, Mac |
WVAP Neural Activity Scalp-Swing-Brake_noSourceCode | 4.5 (2) | — | 1 | $59 | Windows, Mac |
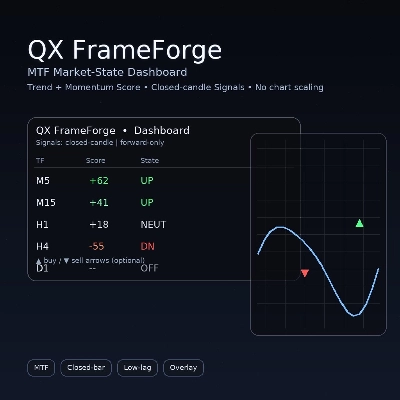
QX FrameForge | 5.0 (3) | — | 1 | $19 | Windows, Mac |
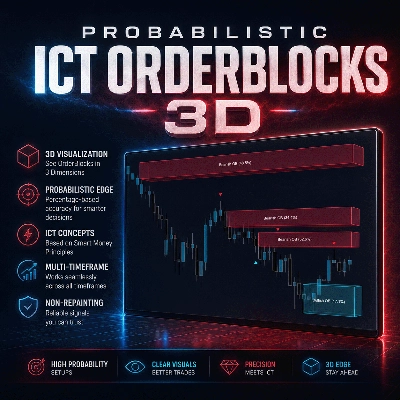
Probabilistic ICT OrderBlocks 3D | — | — | — | dari $17 | Windows, Mac |
AlgoCorner Trading Dashboard MP | 4.5 (2) | — | — | $39 | Windows, Mac, Mobile, Web |
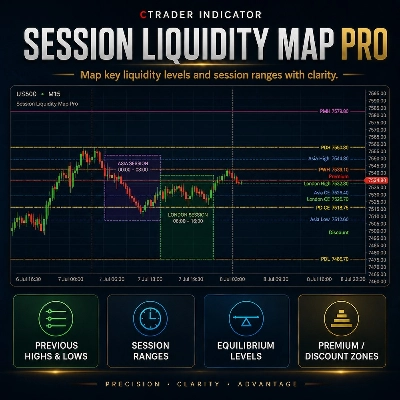
Session Liquidity Map Pro | — | — | — | dari $9 | Windows, Mac |
EMA cBot Strategy Indicator | — | — | — | $39 | Windows, Mac |
ApexMarketStructurePro | — | — | — | $697 | Windows, Mac |
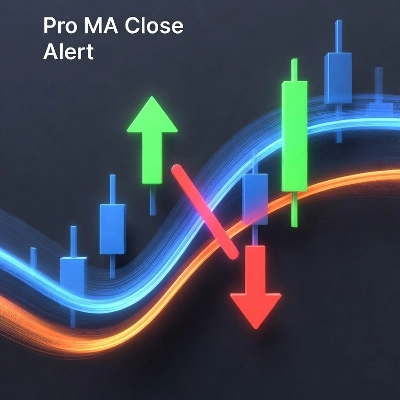
Pro MA Close Alert | — | — | — | $19 | Windows, Mac |
Cross-Timeframe Trend-vs-Noise Index | — | — | — | $30 | Windows, Mac |
MiniBull Observer Pro | 5.0 (1) | — | — | dari $50 | Windows, Mac |
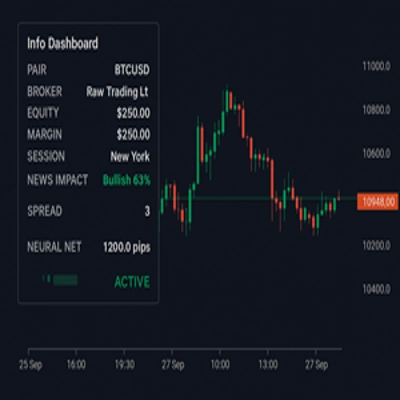
Info Dashboard_noSourceCode | 4.3 (3) | — | — | $19 | Windows, Mac |
MACRO_ZERO VOLUME IMBALANCE STRIP | 5.0 (1) | — | — | $40 | Windows, Mac, Web |
Soalan Lazim
Trade analytics dashboards turn closed trades into statistics such as win rate, expectancy, drawdown and the spread of outcomes. Many let you drill into a symbol, a session or a setup, which shows where results come from rather than only what the account total did.
Expectancy is the average result per trade, combining how often trades win with the typical size of wins and losses. A positive figure from a short sample can be luck, so look at how many trades it rests on, and keep in mind that history describes the past without predicting the future.
Mostly not, because the majority of products here are indicators, and indicators from cTrader Store need the Windows or Mac app. A web-based plugin is the exception, opening in every cTrader app, so the description tells you which kind a given dashboard is.
Dashboards that filter history by symbol, time or strategy tag can isolate a cBot's trades from manual ones, which a blended account total cannot do. Check which filters a product offers, whether it covers several accounts and whether you can try it free or on trial before you commit.
No, an analytics indicator only reads account history and draws results; it cannot send or modify orders. A dashboard built as a cBot has the technical ability to trade, so confirm in its description that it only reads data and start it on a demo account before attaching it to live funds.