
SmartMoneyConceptsIndicator
Indikator
Version 1.0, Oct 2025
Windows, Mac
5.0
Bewertungen: 2
Beschreibung
Hauptmerkmale:
- HTF-Analyse: Anzeige des Trends im höheren Zeitrahmen (BULLISH↑/BEARISH↓)
- Strukturerkennung:
-
- CHoCH = Trendwende
- BOS = Trendfortsetzung
- Interne (kurzfristige) / Swing (mittelfristige) Doppelschichten
- Order Blocks:
-
- ★OB = Wichtiger OB direkt nach CHoCH
- Regulärer OB = Halbtransparent
- OB gegen HTF = Mehr transparent
- 🎯TP: Take-Profit-Ziel (vorheriges Strukturlevel)
- ? OB: Vorhergesagte Einstiegszone
- ▲/▼ EINSTIEG: Signal bei HTF-ausgerichtetem OB-Kontakt
Anwendung:
- Trend mit HTF-Informationen prüfen
- Auf CHoCH-Bildung warten
- EINSTEIG bei ★OB-Kontakt
- Ausgang bei 🎯TP
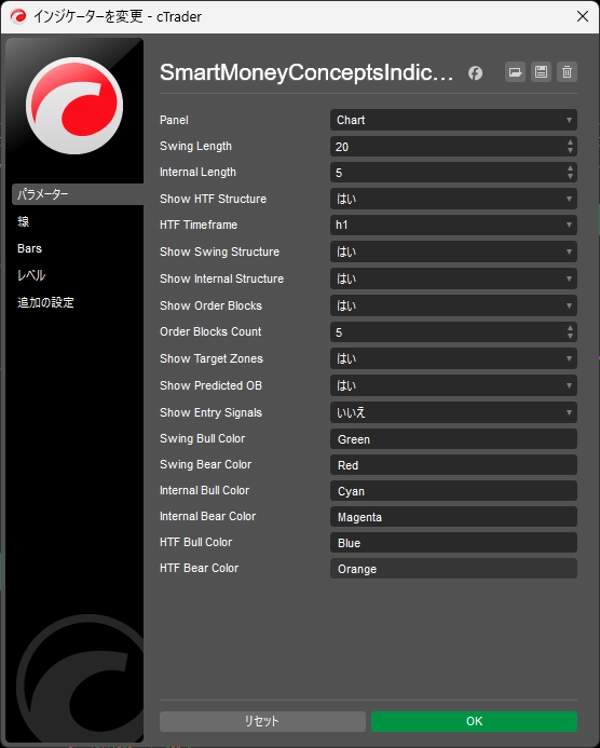
Parameter:
- HTF-Zeitrahmen: Höheren Zeitrahmen auswählen
- Swing/Internal Länge: Empfindlichkeit anpassen
- Einstiegssignale anzeigen: Signal EIN/AUS
Zusammenfassung
Indikatorprofil
Kundenbewertungen
5.0
Bewertungen: 2
5 | 100 % | |
4 | 0 % | |
3 | 0 % | |
2 | 0 % | |
1 | 0 % |
Diskussion
Häufig gestellte Fragen (FAQ)
Forex
Signal
Breakout
EURUSD
Supertrend
GBPUSD
Fair Value Gap
NZDUSD
SMC
USDJPY
Über den cTrader Store verfügbare Produkte, einschließlich Handelsbots, Indikatoren und Plugins, werden von externen Entwicklern bereitgestellt und nur zu Informations- und technischen Zugriffszwecken verfügbar gemacht. cTrader Store ist kein Broker und erbringt keine Anlageberatung, persönlichen Empfehlungen oder eine Garantie für zukünftige Performance.
Mehr von diesem Autor


![„[Hamster-Coder] Pivot Points MTF“-Logo](https://cdn.ctrader.com/image/webp/4c143e5a-309c-40e3-a578-f04d1e133ffa_31159)


Preis
1
Verkäufe
1.41K
Kostenlose Installationen