
Beschreibung
Verwandeln Sie Preischaos in klare Trendkanäle mit präziser Regressionsmathematik.
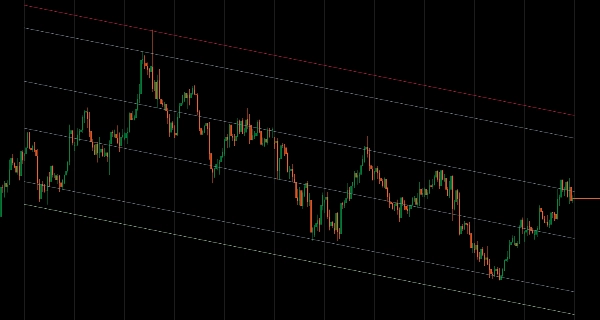
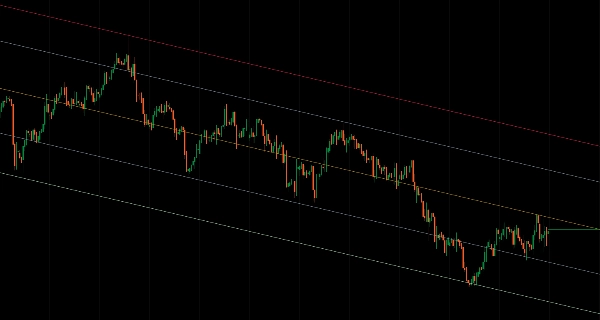
Der Regressionskanal berechnet eine lineare Regressionslinie durch Ihre ausgewählten Preisdaten und zeichnet obere/untere Grenzen basierend auf Preisabweichungen – so erhalten Sie eine statistisch fundierte Ansicht der Trendrichtung und potenzieller Umkehrzonen.
Perfekt für
- Strukturtrader, die eine objektive Trenddefinition suchen
- Mean-Reversion-Trader, die überkaufte/überverkaufte Extreme identifizieren
- Breakout-Trader, die Kanalverletzungen und Momentumwechsel erkennen
- Multi-Timeframe-Analyse – zeichnen Sie monatliche Regressionen auf Tagescharts für Kontext
Hauptmerkmale
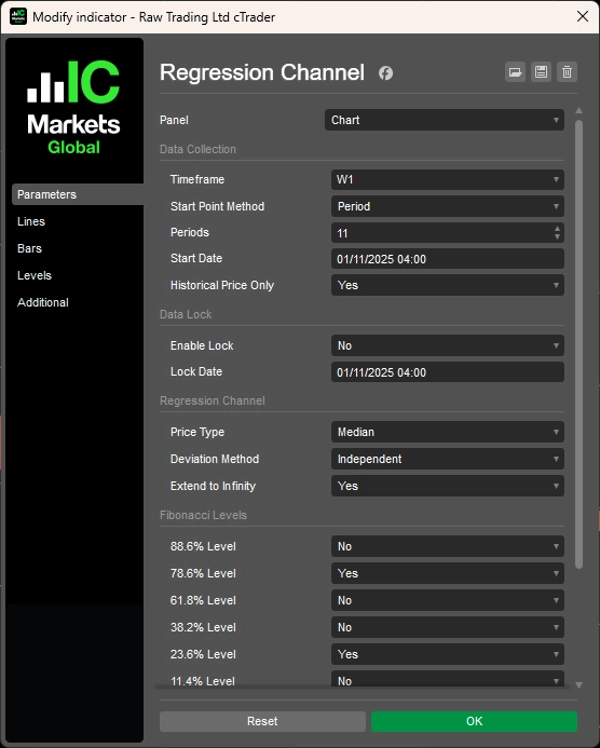
- Flexible Datenauswahl
-
- Periodenmodus: Analysieren Sie die letzten N Kerzen (z.B. die letzten 12 Monatskerzen)
- Datum/Uhrzeit-Modus: Starten Sie von bestimmten Marktereignissen oder Daten
- Sperrmechanismus: Frieren Sie die Analyse an einem historischen Punkt ein, während der Preis weiterläuft
- Multi-Timeframe: Zeichnen Sie Regressionen aus jedem Zeitrahmen auf Ihrem aktuellen Chart
- Intelligente Abweichungsmethoden
-
- Durchschnitt: Ausgewogene Niveaus unter Verwendung von mittleren Abweichungen (ideal für Handelszonen)
- Unabhängig: Asymmetrische Kanäle, die sich an richtungsabhängige Volatilität anpassen
- Maximum: Zeigt extreme Preisgrenzen für eine vollständige Bereichsanalyse
- Professionelle Werkzeuge
-
- 6 Fibonacci-Retracement-Level (11,4 %, 23,6 %, 38,2 %, 61,8 %, 78,6 %, 88,6 %)
- 6 Preistypen: Eröffnung, Hoch, Tief, Schluss, Median, Typisch
- Nur historischer Modus: Schließt sich bildende Kerzen für stabile Backtests aus
- Option zur unendlichen Verlängerung für langfristige Projektionen
- Volle Farbgestaltung
Warum es herausragt
Im Gegensatz zu einfachen Regressionswerkzeugen gibt Ihnen dieser Indikator Kontrolle. Sperren Sie Ihre Analyse, um zu untersuchen, wie sich der Preis nach einem bestimmten Ereignis verhalten hat. Wechseln Sie zwischen symmetrischen und asymmetrischen Kanälen. Kombinieren Sie die Struktur höherer Zeitrahmen mit der Ausführung niedrigerer Zeitrahmen – alles mit sauberem, effizientem Code, der auf Zuverlässigkeit ausgelegt ist.
Saubere Charts. Klare Struktur. Selbstbewusste Entscheidungen.


