Opis
━━━━━━━━━━━━━━━━━━━━━━━━━━━━━━━━━━━━━━━━
ATR Risk Visualizer — Ryzyko
━━━━━━━━━━━━━━━━━━━━━━━━━━━━━━━━━━━━━━━━
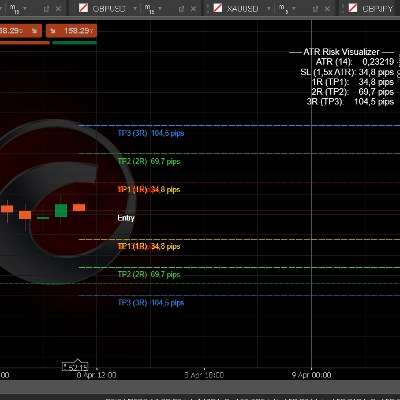
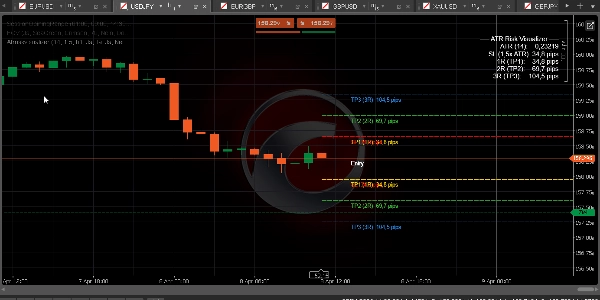
Natychmiast wizualizuje Twoje poziomy Stop Loss i Take Profit oparte na ATR — z pełnym mapowaniem wielokrotności R (1R do 5R) oraz etykietami pipsów — dzięki czemu zawsze handlujesz z określonym ryzykiem przed wejściem w pozycję.
─────────────────────────────
KLUCZOWE CECHY
► Stop Loss oparty na ATR — odległość SL obliczana jako ATR × konfigurowalny mnożnik (domyślnie 1,5×)
► Wielokrotności R Take Profit — TP1 (1R), TP2 (2R), TP3 (3R), TP4 (4R), TP5 (5R) rysowane automatycznie od bieżącej ceny
► Etykiety pipsów na każdym poziomie — zobacz dokładną odległość w pipsach dla SL i każdego TP na pierwszy rzut oka
► Poziomy Long i Short jednocześnie — lub przełącz na tryb tylko Long lub tylko Short
► Selektor interwału czasowego ATR — oblicz ATR z wyższego interwału (np. ATR H1 na wykresie M15)
► Panel informacji ATR (prawy górny róg) — pokazuje wartość ATR, wielkość SL oraz TP1/2/3 w pipsach
► Pełna kontrola kolorów — oddzielne kolory dla SL, TP1, TP2, TP3, TP4/5 za pomocą natywnych selektorów kolorów cTrader
► Konfigurowalny styl linii (ciągła / kreski / kropki) i grubość
► Cena Ask lub Bid jako odniesienie wejścia — wybierz w zależności od kierunku handlu
─────────────────────────────
USTAWIENIA DOMYŚLNE
→ Okres ATR 14
→ Mnożnik ATR 1,5× (SL = 1,5 × ATR)
→ Interwał ATR H1
→ Pokaż TP1/2/3 WŁ.
→ Pokaż TP4/5 WYŁ.
→ Kierunek Oba (Long + Short)
→ Kolor SL Czerwony
→ Kolor TP1 Złoty
→ Kolor TP2 LimeGreen
→ Kolor TP3 DodgerBlue
→ Styl linii Kreski
─────────────────────────────
JAK UŻYWAĆ
1. Dodaj wskaźnik do dowolnego wykresu
2. Ustaw okres ATR i mnożnik zgodnie z Twoją strategią (1,5× ATR to standard dla Forex/Złota)
3. Ustaw interwał ATR na H1 lub H4 dla płynniejszego określania wielkości SL
4. Odczytaj wartości pipsów bezpośrednio z etykiet na wykresie
5. Użyj TP1 (1R) do pierwszej części wyjścia, TP2 (2R) do breakeven, TP3 (3R) do pełnego celu
6. Połącz z wskaźnikami BOS/CHoCH i FVG dla kompletnego workflow wejścia SMC
─────────────────────────────
IDEALNE DLA
✔ Traderów FTMO i firm prop, którzy muszą precyzyjnie określać ryzyko
✔ Traderów SMC i ICT używających wielokrotności R do zarządzania handlem
✔ Traderów Forex, Złota i Indeksów na dowolnym interwale czasowym
✔ Traderów, którzy chcą mieć jasną wizualną mapę ryzyka przed każdym wejściem
✔ Każdego, kto buduje systematyczne podejście do określania wielkości pozycji
─────────────────────────────
KOMPATYBILNOŚĆ
→ Platforma cTrader (Desktop & Web)
→ Klasy aktywów Forex, Indeksy, Surowce, Crypto CFD
→ Interwały Wszystkie (M1 do MN)
→ Uprawnienia Brak wymagań
→ Typ konta Live & Demo
━━━━━━━━━━━━━━━━━━━━━━━━━━━━━━━━━━━━━━━━
Podsumowanie
Opinie klientów
5 | 50 % | |
4 | 50 % | |
3 | 0 % | |
2 | 0 % | |
1 | 0 % |