Keltner Channels advanced
Indikator
Versi 1.0, Apr 2026
Windows, Mac
5.0
Ulasan: 1
Penerangan
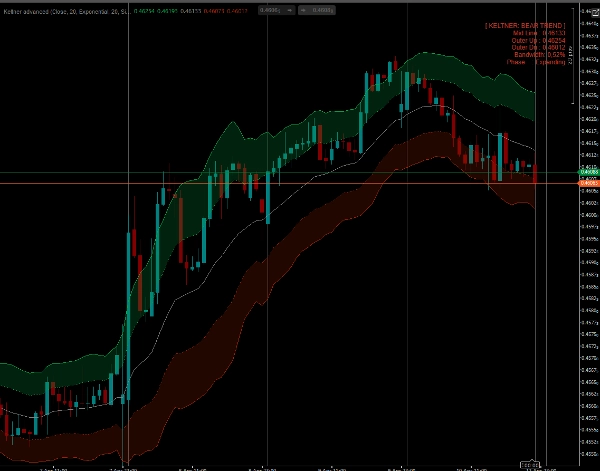
Sistem Awan & Pecahan Lanjutan Saluran Keltner
Saluran Keltner Standard adalah alat yang hebat untuk membaca volatiliti dan arah tren, tetapi melukis garis mudah pada carta hanyalah permulaan.
The Keltner Advanced membawa penunjuk klasik ini ke tahap yang lebih tinggi. Dengan memperkenalkan Sistem Awan Jalur Berganda, Pengesanan Pemampatan Lebar Jalur, dan Paintbars Pintar, ia mengubah saluran mudah menjadi sistem perdagangan visual lengkap untuk pedagang pecahan dan pengikut tren.
Ciri Utama
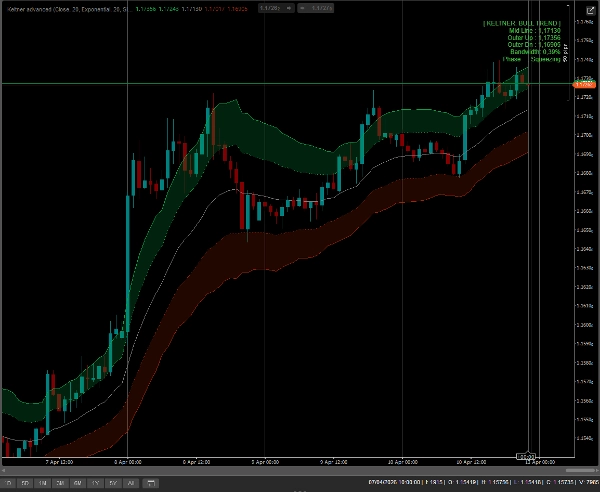
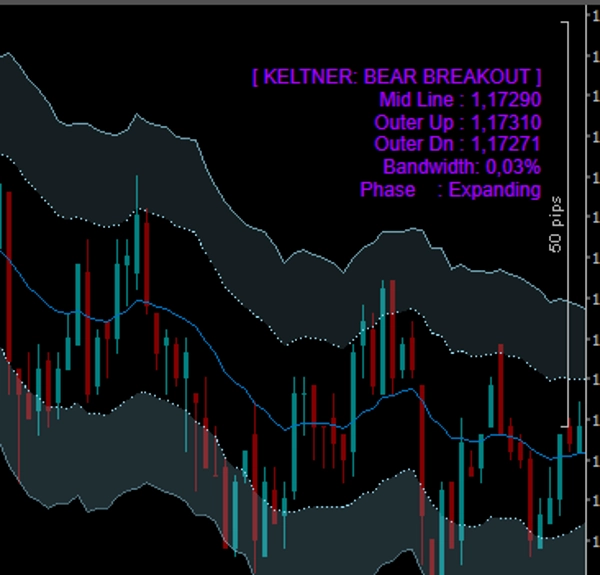
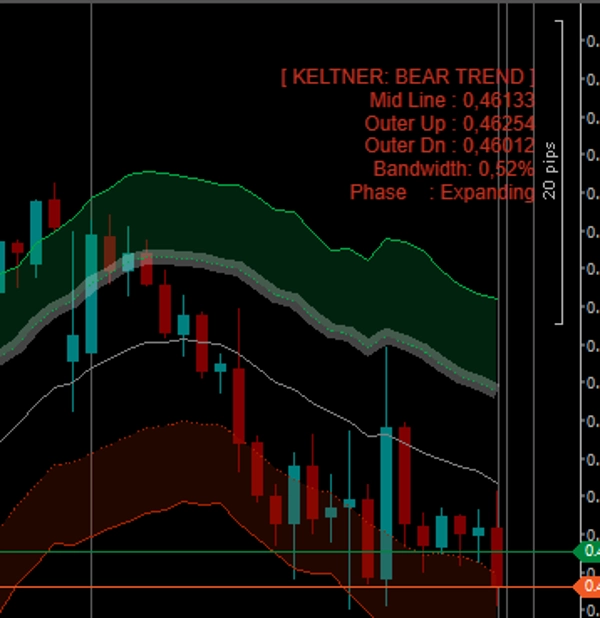
- Sistem Awan Jalur Berganda (Zon Tindakan): Bukannya satu saluran, penunjuk ini melukis Jalur Dalam dan Jalur Luar. Ruang di antara mereka diisi dengan Awan dinamik.
-
- Harga di dalam Awan? Anda berada dalam "Penunggang Tren" yang kuat dan sihat.
- Harga antara Garis Tengah dan Jalur Dalam? Anda berada dalam fasa penarikan balik / pembalikan purata.
- Pewarnaan Bar Pintar (Paintbars): Lilin anda akan berubah warna berdasarkan lokasi tepat mereka dalam struktur saluran:
-
- Hijau/ Merah Neon (Ekstrem): Harga pecah di luar Jalur Luar. Momentum besar atau kemuncak!
- Hijau/ Merah Cerah (Tren): Harga berada di dalam Awan Keltner.
- Hijau/ Merah Gelap (Penarikan Balik): Harga menarik balik ke Garis Tengah.
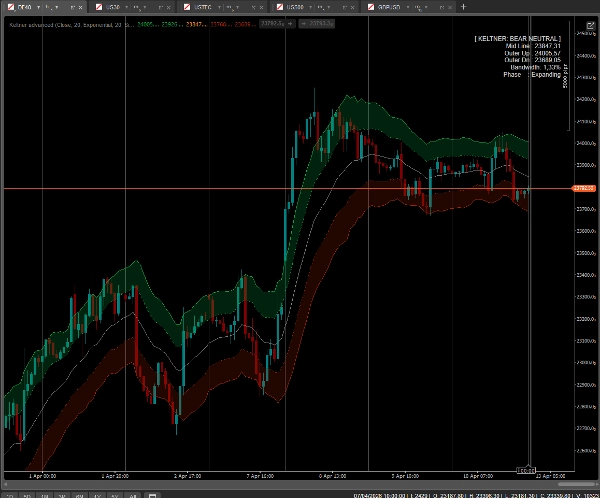
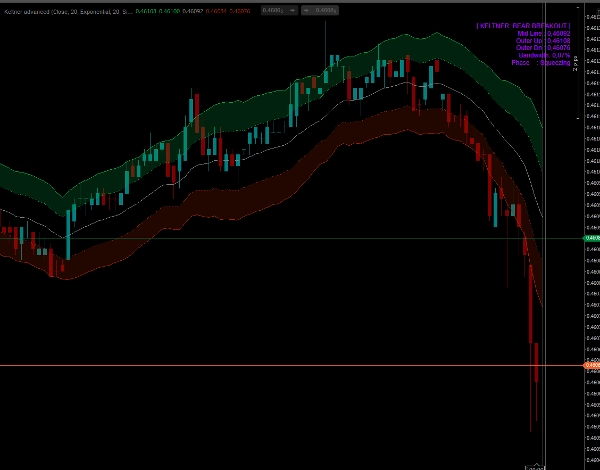
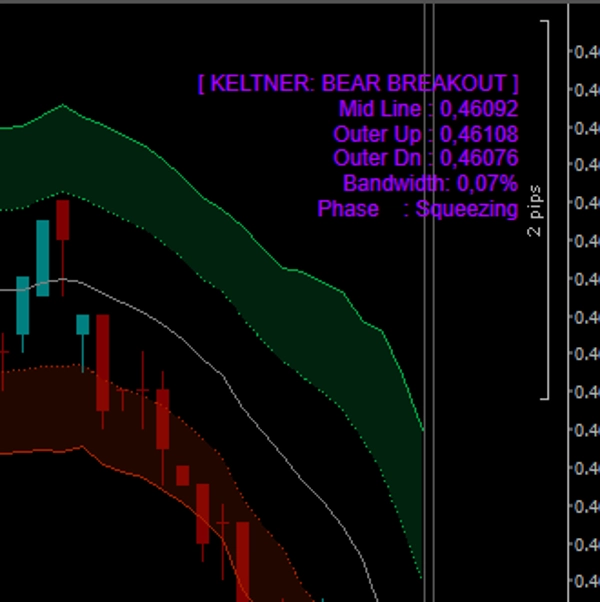
- Pengesanan Pemampatan Lebar Jalur: Penunjuk sentiasa mengira lebar saluran dan membandingkannya dengan bar sebelumnya. Papan pemuka akan memberitahu anda dengan tepat jika pasaran sedang Memampat (memampat untuk pecahan) atau Mengembang.
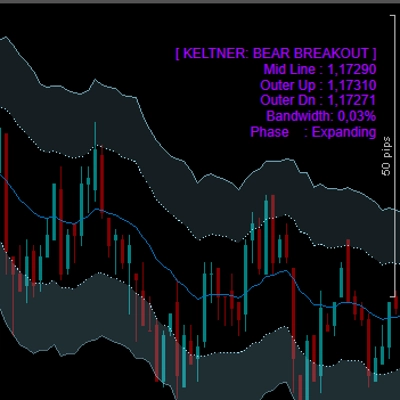
- Papan Pemuka Masa Nyata Pada Carta: Panel yang kemas dan tidak mengganggu memaparkan Keadaan Pasaran semasa (Tren Bull, Pecahan Bear, Neutral, dll.), tahap Jalur tepat, peratusan Lebar Jalur, dan Fasa Volatiliti.
- Terbuka Sepenuhnya: Berdagang pada mana-mana simbol (Forex, Crypto, Indeks, Saham) dan mana-mana jangka masa tanpa had. Akses seumur hidup.
Bagaimana untuk berdagang dengannya?
- Pecahan: Lihat papan pemuka untuk fasa "Memampat". Apabila harga meletup di luar Jalur Luar dan lilin dicat Hijau atau Merah Neon, berdagang pecahan dengan momentum kuat.
- Menunggang Tren: Setelah tren ditetapkan, kekal dalam perdagangan anda selagi lilin dicat Hijau/ Merah Cerah dan "meluncur" di dalam Awan.
- Membeli Semasa Penurunan: Apabila harga menarik balik ke Garis Tengah oren (lilin menjadi hijau gelap), ia sering memberikan kemasukan risiko rendah untuk menyertai tren utama.
Ringkasan
Profil indikator
Kategori indikator
Kemeruapan
Jenis output
Visualisasi
Isyarat
Tapis
Keperluan data
Bar sahaja
Isyarat yang disokong
Kekuatan trend
Kemeruapan
Terobosan
Ulasan pelanggan
5.0
Ulasan: 1
5 | 100 % | |
4 | 0 % | |
3 | 0 % | |
2 | 0 % | |
1 | 0 % |
Perbincangan
Soalan Lazim
Key Levels
Channel
Produk yang tersedia melalui cTrader Store, termasuk bot dagangan, indikator dan plugin, disediakan oleh pembangun pihak ketiga dan diberikan akses untuk tujuan maklumat dan teknikal sahaja. cTrader Store bukan broker dan tidak memberikan nasihat pelaburan, syor peribadi atau sebarang jaminan prestasi masa hadapan.


Harga
24
Jualan
710
Pemasangan percuma