

WeTrades Liquidity Swings
Indikator
284 downloads
Version 1.0, Apr 2026
Windows, Mac

3.82K
Kostenlose Installationen
Beschreibung
Liquidity Swings
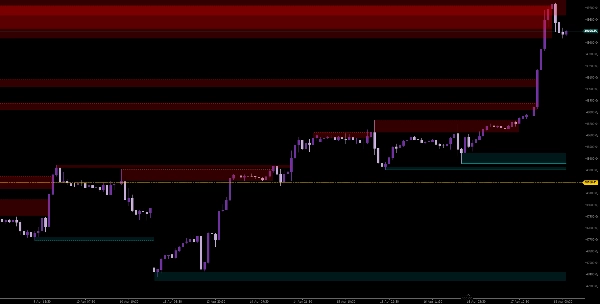
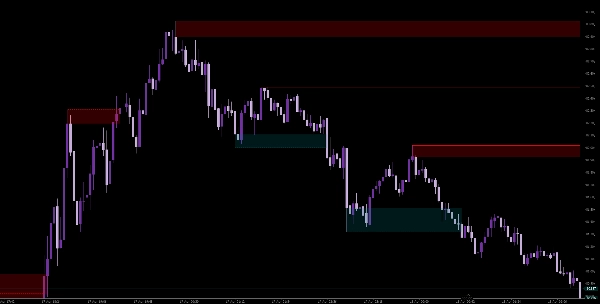
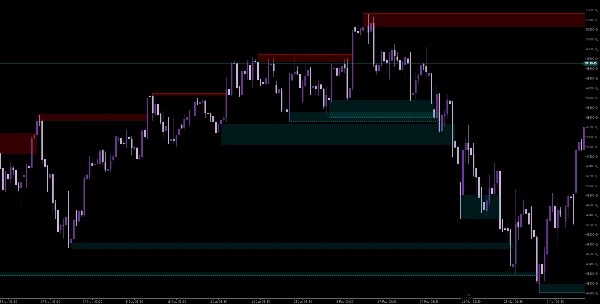
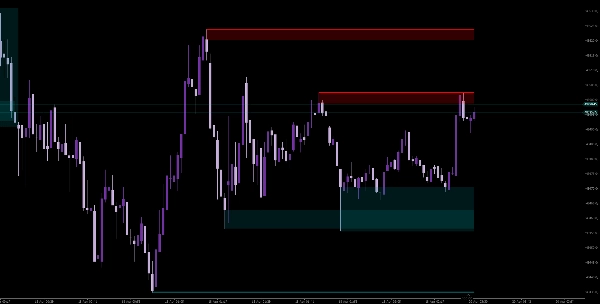
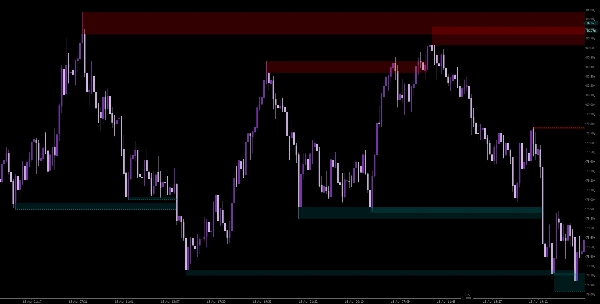
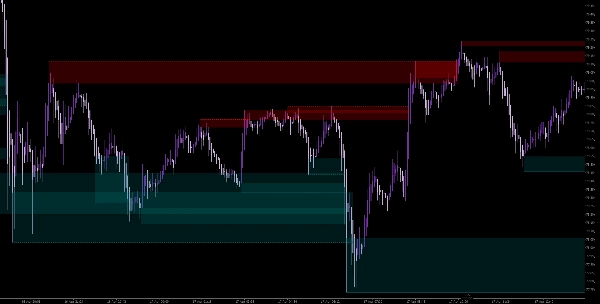
Liquidity Swings ist ein präzises Werkzeug, das entwickelt wurde, um wichtige Liquiditätszonen zu identifizieren und zu visualisieren, die sich um Swing-Hochs und -Tiefs bilden. Entwickelt für Trader, die sich auf die Marktstruktur konzentrieren, hebt dieser Indikator Bereiche hervor, in denen der Preis wahrscheinlich reagiert, sich umkehrt oder mit Momentum durchbricht.
Hauptmerkmale
- Automatische Swing-Erkennung
Identifiziert Pivot-Hochs und -Tiefs anhand eines konfigurierbaren Rückblickzeitraums. - Visualisierung von Liquiditätszonen
Zeigt Zonen basierend auf: -
- Docht-Extremitäten (präzise Einstiege)
- Gesamte Kerzenreichweite (breitere Liquiditätsbereiche)
- Berührungserfassung
Zählt, wie oft der Preis mit jeder Zone interagiert, um Stärke und Bedeutung einzuschätzen. - Break-Bestätigung
Markiert deutlich, wenn ein Liquiditätsniveau mit einem bestätigten Schlusskurs außerhalb des Niveaus durchbrochen wird. - Dynamische Chart-Objekte
Zonen und Niveaus erstrecken sich in Echtzeit und aktualisieren sich nur bei bestätigten Kerzen für Genauigkeit. - Anpassbares Erscheinungsbild
-
- Getrennte Farben für Hochs und Tiefs
- Anpassbare Zonen-Deckkraft
- Optionale Anzeige von Swing-Hochs/-Tiefs
- Leistungsoptimiert
Effiziente Handhabung von Chart-Objekten mit einem konfigurierbaren Limit für gespeicherte Niveaus.
Wie es Ihnen beim Trading hilft
- Identifizieren Sie Liquiditätspools, wo Stops wahrscheinlich liegen
- Erkennen Sie Ablehnungszonen für potenzielle Umkehrungen
- Bestätigen Sie Ausbrüche mit strukturbezogener Validierung
- Verbessern Sie Einstiegspräzision durch wiederholte Berührungen
Beste Anwendungsfälle
- Smart Money Concepts (SMC)
- Liquiditätsbasierte Handelsstrategien
- Verfeinerung von Unterstützung & Widerstand
- Ausbruchs- und Retest-Setups
Parameter
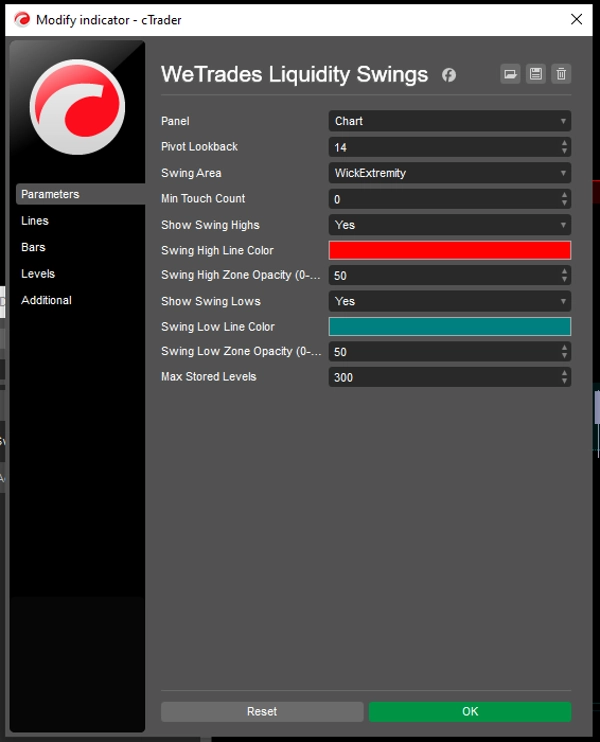
- Pivot Lookback – Definiert die Swing-Empfindlichkeit
- Swing Area Mode – Docht oder gesamte Reichweite
- Min Touch Count – Filtert schwächere Niveaus
- Max Stored Levels – Kontrolliert Chart-Unordnung
Zusammenfassung
KI-Zusammenfassung
WeTrades Liquidity Swings is a technical indicator designed to identify and visualize key liquidity zones around swing highs and lows on price charts. It automatically detects pivot points using a configurable lookback period and highlights liquidity zones based on either wick extremities for precise entries or full candle ranges for broader areas. The indicator tracks how many times price touches each zone, aiding in assessing their strength, and confirms breaks by marking when price closes beyond a liquidity level. Zones dynamically extend in real time and update only on confirmed candles to maintain accuracy. Users can customize the appearance with separate colors for highs and lows, adjustable opacity, and optional swing point display. The tool is optimized for performance with limits on stored levels to reduce chart clutter. It supports trading approaches focused on Smart Money Concepts, liquidity-based strategies, refined support and resistance, and breakout/retest setups. Parameters include pivot lookback sensitivity, swing area mode, minimum touch count filter, and maximum stored levels. This indicator provides visual structure clarity to help traders identify liquidity pools, rejection zones, confirm breakouts, and improve entry precision.
Indikatorprofil
Indikatorkategorie
Unterstützung und Widerstand
Ausgabetyp
Visualisierung
Datenanforderungen
Nur Balken
Unterstützte Signale
Ausbruch
Wendepunkt
Level – Berührung
Level – Durchbrechen
Eröffnungsspanne der Sitzung
Kundenbewertungen
0.0
Bewertungen: 0
Kundenbewertungen
Bisher gibt es keine Bewertungen für dieses Produkt. Haben Sie es schon ausprobiert? Dann können Sie die erste Person sein, die andere darüber informiert!
Diskussion
Häufig gestellte Fragen (FAQ)
Key Levels
MSS
Market Structure
Support & Resistance
Über den cTrader Store verfügbare Produkte, einschließlich Handelsbots, Indikatoren und Plugins, werden von externen Entwicklern bereitgestellt und nur zu Informations- und technischen Zugriffszwecken verfügbar gemacht. cTrader Store ist kein Broker und erbringt keine Anlageberatung, persönlichen Empfehlungen oder eine Garantie für zukünftige Performance.
Mehr von diesem Autor



























Preis
3.82K
Kostenlose Installationen