Beschreibung
Indikatorübersicht
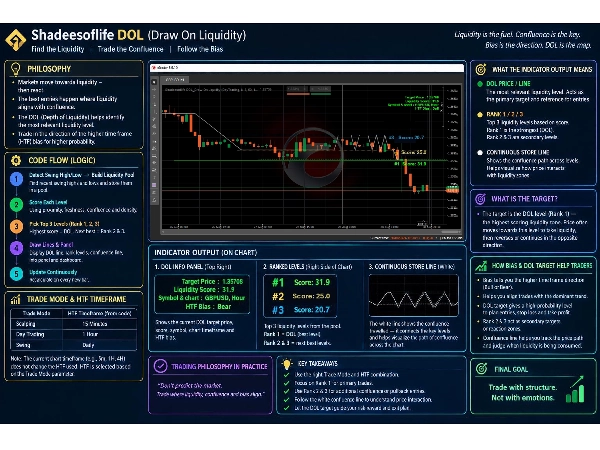
Der Shadeesoflife DOL (Draw on Liquidity) c Trader Indikator bietet eine dynamische Zielerkennung basierend auf Smart Money Concepts (SMC) und ICT-Prinzipien. Er zeichnet automatisch eine Linie auf Liquidität (DOL), ordnet und verfolgt strukturelle Liquiditätspools – "Hohe Konfluenz" im gesamten Markt bei jedem Tick. DOL ist ein dynamisches Ziel, hochkonfluente Liquidität.
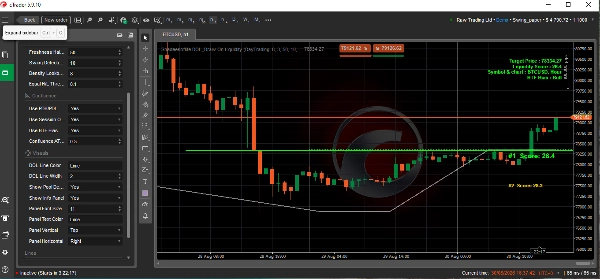
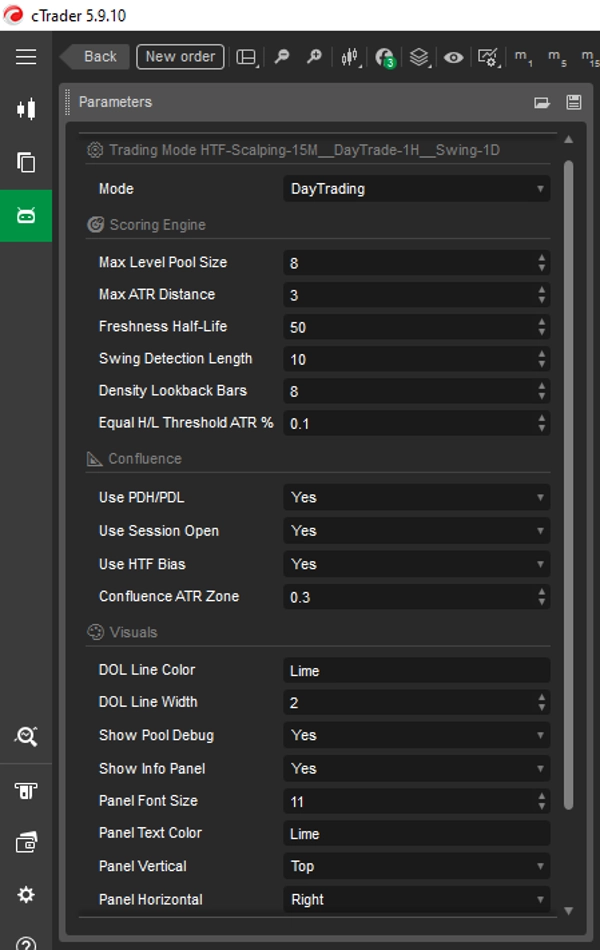
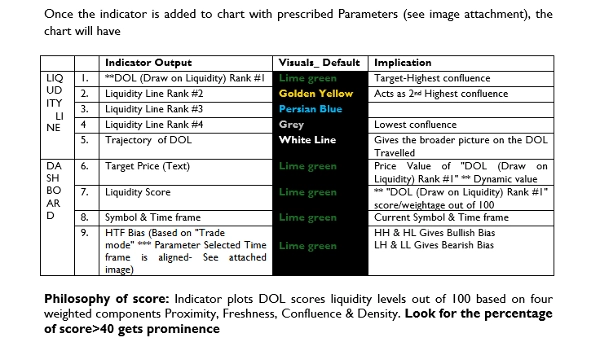
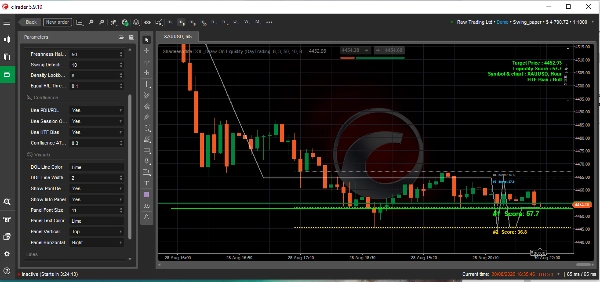
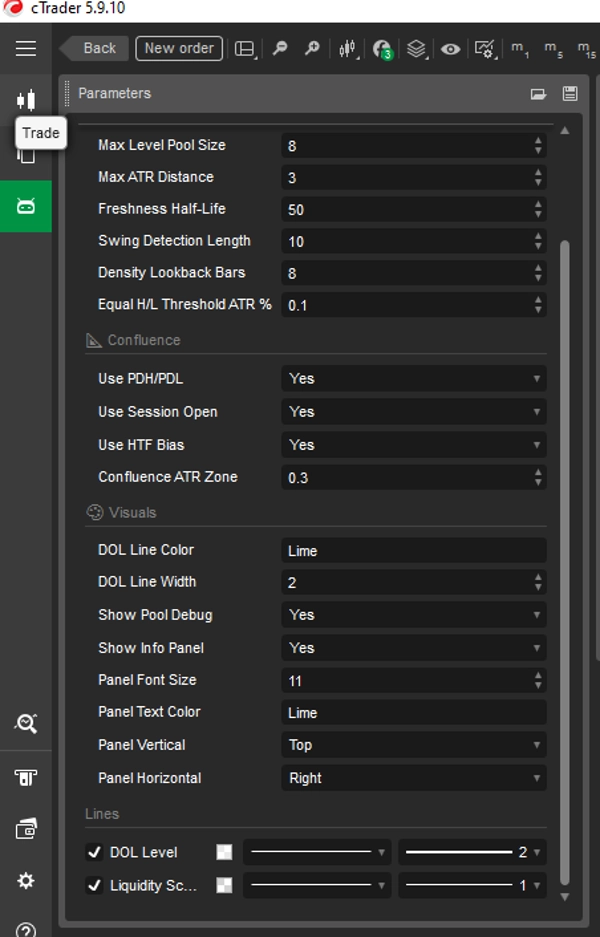
Der Indikator gibt ein primäres DOL-Ziel (höchstbewertetes Niveau, dargestellt als prominente Linie) zusammen mit einem bewerteten Pool sekundärer Liquiditätsziele aus und zeigt ein On-Screen-Panel mit der aktuellen HTF-Tendenz und Zielmetriken. Sobald der Indikator mit den vorgeschriebenen Parametern (siehe Bildanhang) zum Chart hinzugefügt wird, enthält das Chart
Für die Antwort – siehe angehängtes Bild (Tabelle).
Philosophie der Bewertung: Der Indikator zeichnet DOL Bewertungen von Liquiditätsniveaus von 0 bis 100 basierend auf vier gewichteten Komponenten Nähe, Frische, Konfluenz & Dichte.
FAQs
1.Wie es funktioniert – HTF & LTF Multi-Timeframe Strategie Rahmenwerk??
Identifizierung der Höheren Zeitrahmen (HTF) Tendenz und Richtung
Der Indikator bestimmt die strukturelle Tendenz anhand der zugrunde liegenden Handelsmodus-Auswahl, um einen höheren Zeitrahmen zu referenzieren (z.B., ***Täglich für Swing, 1-Stunde für Day Trading, 15-Minuten für Scalping):
- Bullische HTF-Tendenz:
- Bedingung: Die HTF-Kerze schließt höher als ihr Eröffnungskurs (HTF Bullisch).
- Indikatorverhalten: Die Bewertungs-Engine zeigt, dass der Zielpreis (#1 bewertete Linie) unter dem Ask/Bid-Preis markiert ist (HTF-Ziel zeigt interne Liquidität und LTF-Zielpreis zeigt externe Liquidität).
- Handelsimplikation: Der Preis sucht Verkaufsseiten-Liquidität (SSL) darunter für eine günstige Rückbewegung, bevor er weiter nach oben geht, oder zielt auf Kaufseiten-Liquidität (BSL) darüber als ultimatives Expansionsziel.
- Bärische HTF-Tendenz:
- Bedingung: Die HTF-Kerze schließt niedriger als ihr Eröffnungskurs (HTF Bär).
- Indikatorverhalten: Die Bewertungs-Engine zeigt, dass der Zielpreis (#1 bewertete Linie) über dem Ask/Bid-Preis markiert ist (HTF-Ziel zeigt interne Liquidität und LTF-Zielpreis zeigt externe Liquidität).
- Handelsimplikation: Der Preis sucht Kaufseiten-Liquidität (BSL) darüber für eine Prämienrückbewegung, bevor er nach unten geht, oder zielt auf Verkaufsseiten-Liquidität (SSL) darunter.
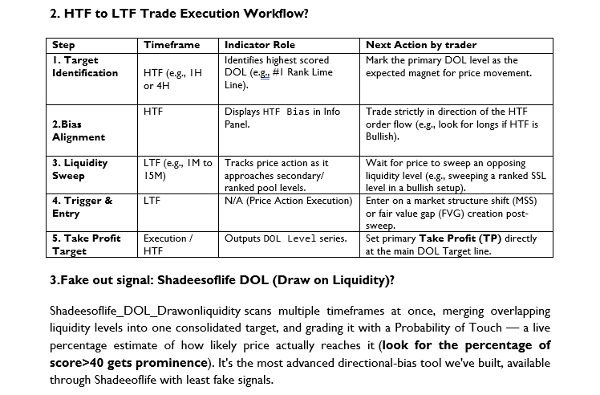
2. HTF zu LTF Handelsausführungs-Workflow?
Für die Antwort – siehe angehängtes Bild (Tabelle).
3.Fake Ausstiegssignal: Shadeesoflife DOL (Draw on Liquidity)?
"Shadeesoflife DOL Draw on liquidity" scannt mehrere Zeitrahmen gleichzeitig, fasst überlappende Liquiditätsniveaus zu einem konsolidierten Ziel zusammen und bewertet es mit einer Wahrscheinlichkeit des Erreichens — eine Live-Prozent-Schätzung, wie wahrscheinlich der Preis tatsächlich dorthin gelangt (achten Sie auf den Prozentsatz der Bewertung>40, der hervorgehoben wird). Es ist das fortschrittlichste Richtungs-Tendenz-Werkzeug, das wir entwickelt haben, verfügbar über Shadeeoflife mit den wenigsten falschen Signalen.
4. Wie funktioniert die Konfluenz im "Shadeesoflife DOL Draw on liquidity" technisch ?
"Shadeesoflife DOL Draw on liquidity" scannt interne Liquidität, externe Liquidität, Order Blocks, Breaker Blocks, FVGs, iFVGs und BSL/SSL für seine Richtungs-Tendenz. DOL Pro läuft auf einer völlig anderen Engine — es scannt EQH/EQL, große FVGs, Sitzungsgrenzen, PDH/PDL und Übernacht-/Wochenendlücken über mehrere Zeitrahmen, liest Sitzungs-Tendenzen wie Judas-Schwünge und Fortsetzungen und bewertet sein Ziel mit einer Live-Wahrscheinlichkeit des Erreichens, mit viel intelligenteren Algorithmen. Dieselbe Richtungs-Tendenz-Mission wie DOL, gebaut auf einer rigoroseren Engine. Liefert das Ergebnis eines hochwahrscheinlichen Setups durch Bereitstellung von Richtung und höherem Konfluenz-Zielpreis.
Liest mehrere Zeitrahmen gleichzeitig, nicht nur einen, scannt EQH/EQL, große FVGs, Sitzungsgrenzen, PDH/PDL und Übernacht-/Wochenendlücken. Liest Sitzungs-Tendenzen — Muster wie Judas-Schwünge und Fortsetzungen.
┌──────────────────────────────────────┐
│ ICT / LIQUIDITÄTSKONZEPTE │
│ DOL • PDH • PDL • Sitzung • HTF │
│ Liquidität • Gleiches Hoch/Tief │
└──────────────────┬───────────────────┘
↓
┌──────────────────────────────────────┐
│ SMC / STRUKTURSCHICHT │
│ Swing Hoch • Swing Tief │
│ Liquiditätspools • HTF-Richtung │
└──────────────────┬───────────────────┘
↓
┌─────────────────────────────────────────┐
│ SHADEESOFLIFE QUANT ENGINE │
│ Nähe X% + Frische Y% + Konfluenz Z% + Dichte A% │
│ │
│ → 0–100 Bewertung → Rang #1/#2/#3 → Dynamischer DOL │
└─────────────────────────────────────────┘
📊Technische Chart-Analyse (angehängte Bildinterpretation)
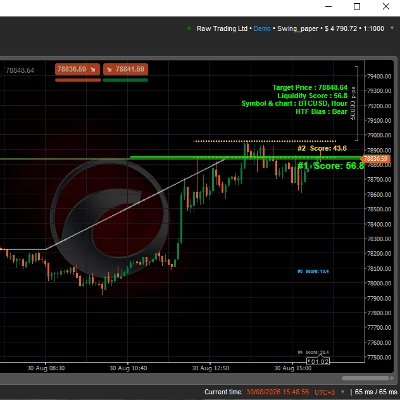
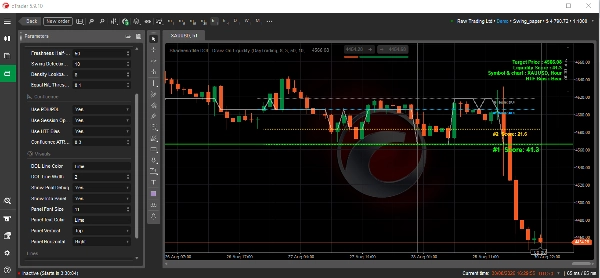
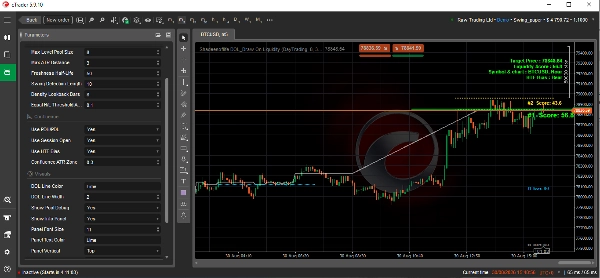
Dieses Chart der cTrader Handelsplattform zeigt BTCUSD (Bitcoin / US-Dollar) auf einem 5-Minuten (m5) Zeithorizont. Es verfügt über einen benutzerdefinierten automatisierten Marktstruktur-Indikator namens "Shadeesoflife DOL Draw On Liquidity", der mit Smart Money Concepts (SMC) konfiguriert ist.
🔎 Wichtige technische Kennzahlen & Analyse
- Aktueller Preis: Der Vermögenswert wird bei 78.856,48 gehandelt und bewegt sich eng innerhalb eines sehr engen, hochliquiden Bereichs.
- Zielpreis / Draw on Liquidity (DOL): Markiert durch die solide hellgrüne horizontale Linie bei 78.848,64. Dies dient als prominenter Magnet für die Kursbewegung.
- Liquiditätsbewertung (57,3): Eine moderate Bewertung, die stabile, aber nicht überwältigende ruhende institutionelle Aufträge um diese Zone anzeigt.
- Höherer Zeitrahmen (HTF) Tendenz: Ausdrücklich als bärisch (Bär) gekennzeichnet. Das System sucht eine Fortsetzung nach unten, sobald die ruhende Kauf-Liquidität bereinigt ist.
- Algorithmische Prioritätsbewertungen:
- #1 Bewertung (57,3): Befindet sich direkt an der grünen Ziellinie.
- #2 Bewertung (45,8): Ruhend etwas höher an der roten Basislinienebene.
💡 Kernstrategische Interpretation
Der Indikator zeichnet ein klassisches SMC-Setup, bei dem die Markt-Engine bestimmte institutionelle Pools abfegen möchte.
- Der Magneteffekt: Der Preis ist in eine Premiumzone gestiegen und bewegt sich nun stark auf die grüne Draw on Liquidity (DOL) Basislinie bei 78.848,64 zu.
- Trend-Ausrichtung: Da die strukturelle HTF-Tendenz bärisch ist, passt dieser lokale Abwärtsschub zur DOL-Linie perfekt zum dominanten Trend.
- Liquiditätsbereinigung: Sobald der Preis die ruhende Liquidität an dieser grünen Linie anvisiert und abbaut, beobachten Händler typischerweise einen entscheidenden strukturellen Bruch oder eine aggressive Fortsetzung der makro-bärischen Richtung.
Hinweis:
- Kann bei BTCUSD, XAUUSD, GBPUSD oder jedem Symbol verwendet werden.
- Die obige BTCUSD-Analyse basiert auf dem Chart LTF 5m (manuelle Auswahl des Charts) und HTF 1TAG (Parameter „Trade Mode“ auf Tageshandel aus Dropdown-Auswahl).
- Der Indikator kann verwendet werden für („Trade Mode“ Parameterwahl entspricht dem Zeitrahmen für BIAS*)
- Scalping – HTF 15M, (Standard)
- Daytrade – HTF 1H,
- Swingtrade – HTF 1D,
- Vier-Stunden-Handel – HTF 4H
- Der Parameter „Show pool debug“ kann verwendet werden, um die weniger wichtigen Ziel-Konfluenzlinien außer Rang #1 auszuschalten.
- Der Parameter „Show info panel“ kann verwendet werden, um das Panel auszublenden.
- Das „Panel“ kann mit Schriftgröße, Textfarbe & Panelposition (horizontal/vertikal) angepasst werden.
- Die Position der „DOL level“-Linie auf der X-Achse (Preis) zeigt die Rang #1 Ziel-Konfluenzlinie an der jeweiligen Y-Achsen-Koordinate (Zeit) an.
Zusammenfassung
The indicator outputs a primary Draw on Liquidity (DOL) target line representing the highest-scored liquidity level, along with secondary ranked targets. It provides an on-screen panel displaying higher timeframe (HTF) bias and target metrics, supporting trading styles from scalping to swing trading by referencing appropriate HTFs (e.g., 15-minute for scalping, daily for swing).
Shadeesoflife DOL integrates multi-timeframe analysis, scanning equal highs/lows, fair value gaps, session boundaries, previous day highs/lows, and gaps to assess directional bias and price magnet levels. It calculates a live Probability of Touch (PoT) percentage estimating the likelihood of price reaching each target.
Traders use the indicator to align trades with HTF bias, identify liquidity sweeps on lower timeframes, and set entries and take profit targets at ranked liquidity pools. It supports markets including BTCUSD and XAUUSD and offers customizable display options for target lines and info panels.